Introduction
One of the most important components of an organization’s factors of production is labor. It is impossible to overestimate the significance of human participation in any cooperative endeavor; it must be given top emphasis. Any organization needs people, or human beings, in addition to money or tangible resources in order to operate efficiently. The collective knowledge, abilities, inventiveness, and acceptance that propel organizational achievement for sustainable development are represented by human resources (HR), which are more than just financial inputs.
For an organization to succeed, its employees are essential. The relationship between workers and the company is the main emphasis of labor management, which is crucial for managing staff members who also make organizational decisions. Long-term trust, motivation, and productivity are developed through this relationship. Human input is still necessary to produce goods and services and meet the requirements and desires of customers, regardless of how sophisticated the machinery or technology is. Additionally, bringing male and female employees together in harmony is the main objective of labor management, which promotes diversity and teamwork to increase production.
Review of literature
Ahmed A. Zaid, Ayham A. M. Jaaron, and Abdul Talib Bon (1) investigated that sustainable performance affected supply chain management, which was their main aim. Hannele Seeck and Marjo-Riitta Diehl (2) conducted a study that was investigated over 25 years, examining the relationship between Human Resource Management (HRM) and innovation. HRM practices influenced innovation.
Annan Bos-Nehles, Maarten Renkema, and Maike Janssen (3) identified that HRM practices can impact employees’ innovative work practices, but are not sure of which behavior it will influence.
The status of the knowledge-based economy requires effective knowledge management. Funmilola Olubunmi Omotayo (4), a major component of every business, is to confirm that a lasting strategic competitive advantage is effective knowledge management.
The study by J. O. Nwele, U. A. Akwana, and A. N. Ngene (5) looked into labor management. Secondarysources to back up the claims. Enhancing government business development metrics and improving the connection between productivity and labor are the main objectives. In 2013, Pawan S. Budhwar and Yaw A. Debrah researched HRM practices in developing countries and their role in economic and organizational development. Rahul Raj and Kailash B. L. Srivastava (6) learned about relationship innovativeness and HRM practices. Marina Dabiæ, Marta Ortiz-De-UrBina-Criado, and Ana M. Romero-Martínez (7) reviewed HRM in Start-ups, where the authors analyzed the current status of HRM in entrepreneurship.
Timothy D. Golden and John F. Veiga (8) studied how the relationship of managers and employees affects virtual workers’ commitment, job satisfaction, and output. Even though their interactions are predicted to have an important influence on individual work outcomes, it has concentrated on outdated work modes. Gundars Kaupins (9) explained the similarity in corporate governance and labor management.
According to David P. Lepak, Hui Liao, Yunhyung Chung, and Erika E. Harden (10), the main feature that distinguishes strategic HRM research is its focus on HR systems rather than HR practices as the motive of individual and organizational performance. Claire Dambrin (11) discussed in his study how telework affects the manager-employee relationship. Authors identified that workers work remotely, and decisions for their careers have decreased. There is less contact between the superior and the subordinates, and face bias. Howard Gospel and Andrew Pendleton (12) review that there is a relationship between corporate governance, labor management, and the structure of finance of the company. Stephon Wood (13) studied that there is high involvement of management practices that may better organizational performance (14).
Chris Brester, Olga Tregaski, Arine Hegewisch, and Lesley Mayne (15) state that comparative HRM research is a relatively new topic. Their study is conceptual and methodological, which makes it more difficult than research directed at the nationwide level. It illustrated the real-world difficulties of conducting a survey and offered solutions from the Cranfield Network on European HRM as an example. Fredric M. Jablin (16) examined superior-subordinate communication and identified various categories of communication patterns between superiors and subordinates. Budhwar and Debrah (17) HRM Practices in developing countries and their contribution toward organizational growth and workforce management.
Research objectives
1. To find the management’s effectiveness in handling employees
2. To analyse the dynamics of the superior-subordinate relationship
3. To know the level of employee satisfaction
4. To study the impact of labor management practices on employee performance
Hypothesis
H0: No impact of Labor management practices on employee performance
H1: There is an impact of labor management practices on employee performance.
Data and methodology
Methods used in this research are a survey through a questionnaire. Secondary data is collected through business documents. The sample for the research is a staff of Master Plannery with a size of 100.
Analysis and data interpretation
*Factory-I *Office-II
Interpretation: Table 1 and Figure 1 show that there are more women than men.

Table 1. Showing gender ratio.

Figure 1. Showing gender ratio (Source: Primary Data, 2020).
Interpretation: As shown in Table 2 and further visualized in Figure 2, out of the 75 responders from the factory, the majority of the organization’s staff members are adults.

Table 2. Showing employee age group.

Figure 2. Showing employee age group (Source: Primary Data, 2020).
Interpretation: Table 3 and Figure 3 clearly illustrate that out of the 75 respondents in the factory, not all are skilled. Consequently, the number of graduates has increased, working in offices, and most factory responders have completed SSLC.
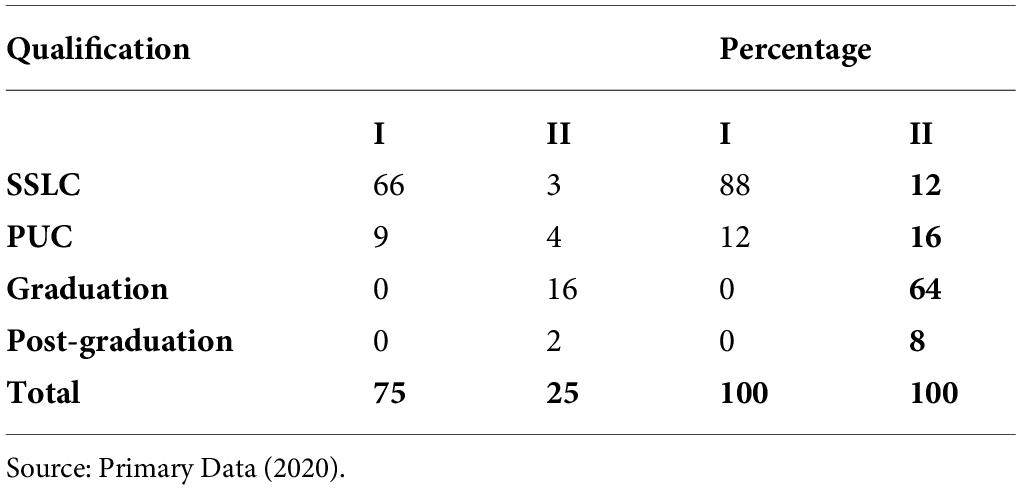
Table 3. Showing the educational background.

Figure 3. Showing the educational background (Source: Primary Data, 2020).
Interpretation: Based on Table 4 and Figure 4, out of 100 respondents, the great majority of the companies’ employees have experience.

Table 4. Showing employees’ experience.

Figure 4. Showing employees’ experience (Source: Primary Data, 2020).
Interpretation: Table 5 and Figure 5 show that individuals are treated well in the Organization.

Table 5. Showing behavior of the company towards individuals.

Figure 5. Showing behavior of the company towards individuals (Source: Primary Data, 2020).
Interpretation: According to Table 6 and Figure 6, it is assumed that factory workers have prioritized equality for factory workers above office workers.
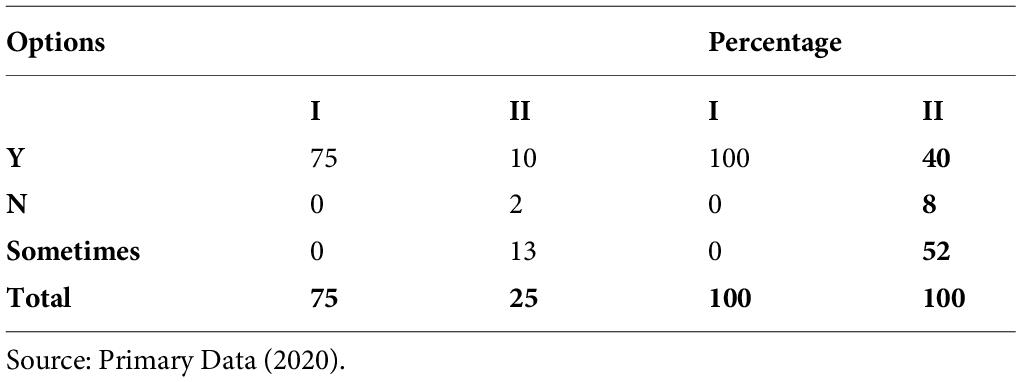
Table 6. Showing equitable treatment for workers.
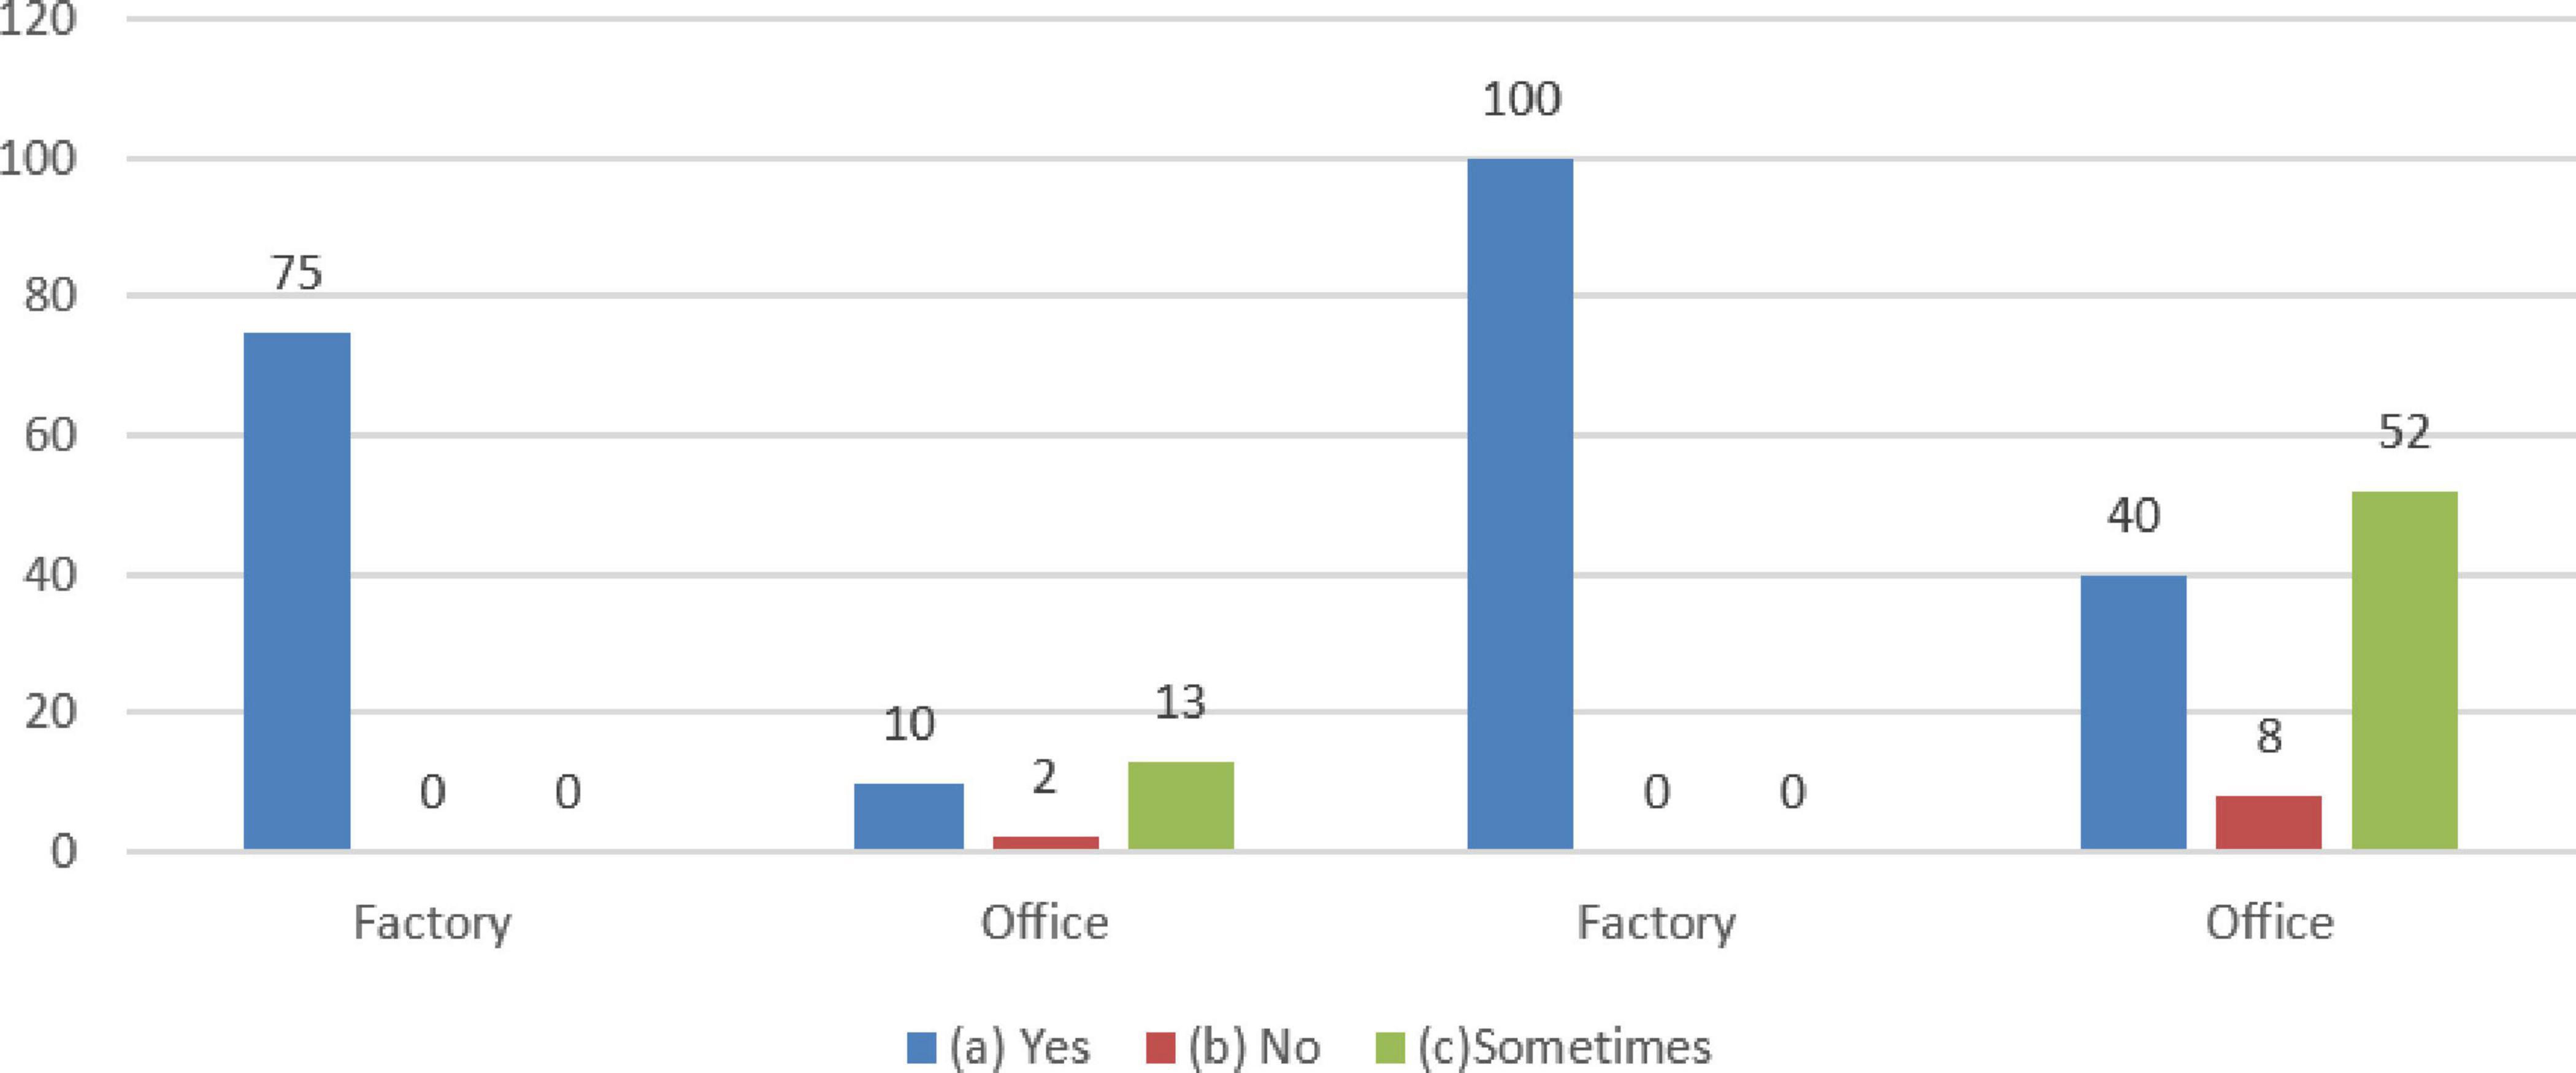
Figure 6. Showing equitable treatment for workers (Source: Primary Data, 2020).
Interpretation: Table 7 and Figure 7 illustrate that most employees in factories and offices are happy in their jobs.
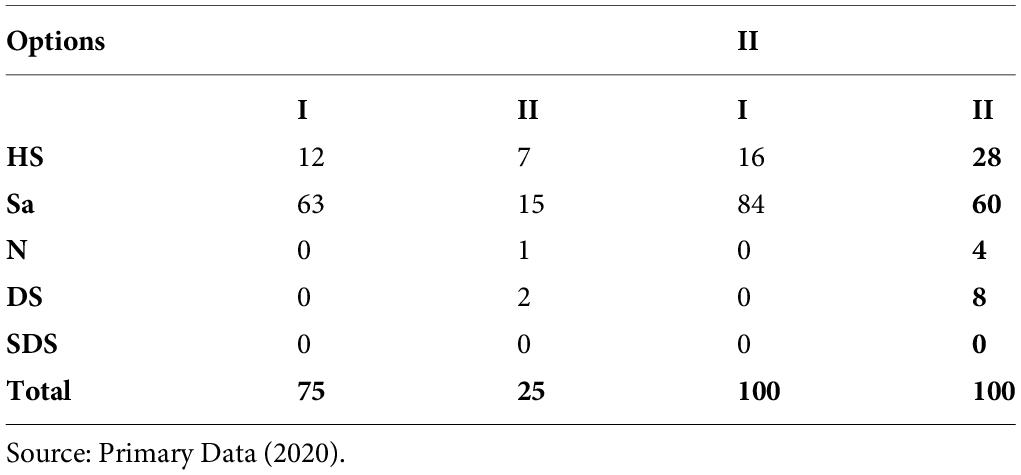
Table 7. Showing workers’ views on their jobs.

Figure 7. Showing workers’ view on their jobs (Source: Primary Data, 2020).
Interpretation: As a result, about 50% of workers in the office and factory have been recognized for their excellent work, which is clearly depicted in the above Table 8 and Figure 8.

Table 8. Showing recognition.

Figure 8. Showing recognition (Source: Primary Data, 2020).
Interpretation: It can be observed from the above Table 9 and Figure 9, workers in factories and offices are not very happy with their pay.

Table 9. Showing satisfaction with salary.

Figure 9. Showing satisfaction with salary (Source: Primary Data, 2020).
Interpretation: Employee perceptions of the company’s working environment are shown in the above Table 10 and Figure 10. The majority of workers in offices and factories are happy with their working conditions.

Table 10. Showing working environment.

Figure 10. Showing working environment (Source: Primary Data, 2020).
Interpretation: It is evident that workers in factories are happier than those in offices, which is clearly depicted in Table 11 and Figure 11.

Table 11. Showing work schedule.

Figure 11. Showing work schedule (Source: Primary Data, 2020).
Interpretation: Employee satisfaction with benefits like PF, ESI, uniforms, books, room facilities, etc., is displayed in the above Table 12 and Figure 12. Workers in factories are happier than those in offices.

Table 12. Showing view about benefits.

Figure 12. Showing view about benefits (Source: Primary Data, 2020).
Interpretation: The Majority of workers are happy with the canteen; manufacturing workers are happier than office workers, which is clearly visible from the above Table 13 and Figure 13.

Table 13. Showing about canteen facility.

Figure 13. Showing about canteen facility (Source: Primary Data, 2020).
Interpretation: From Table 14 and Figure 14, it is clear that 95% of manufacturing workers said their thoughts are considered at work; therefore, it is claimed that the opinions of manufacturing workers are given weight than those of office workers.

Table 14. Showing whether employees’ suggestions are considered or not.

Figure 14. Showing whether employee suggestions are considered or not (Source: Primary Data, 2020).
Interpretation: Everyone needs to train in order to perform. Here, 4% of manufacturing workers stated that training is necessary for their jobs, while 96% disagreed. Therefore, office workers believe they don’t require additional training, but to advance efficiency, training must be provided, which is clearly visible in Table 15 and Figure 15.

Table 15. Showing training program.
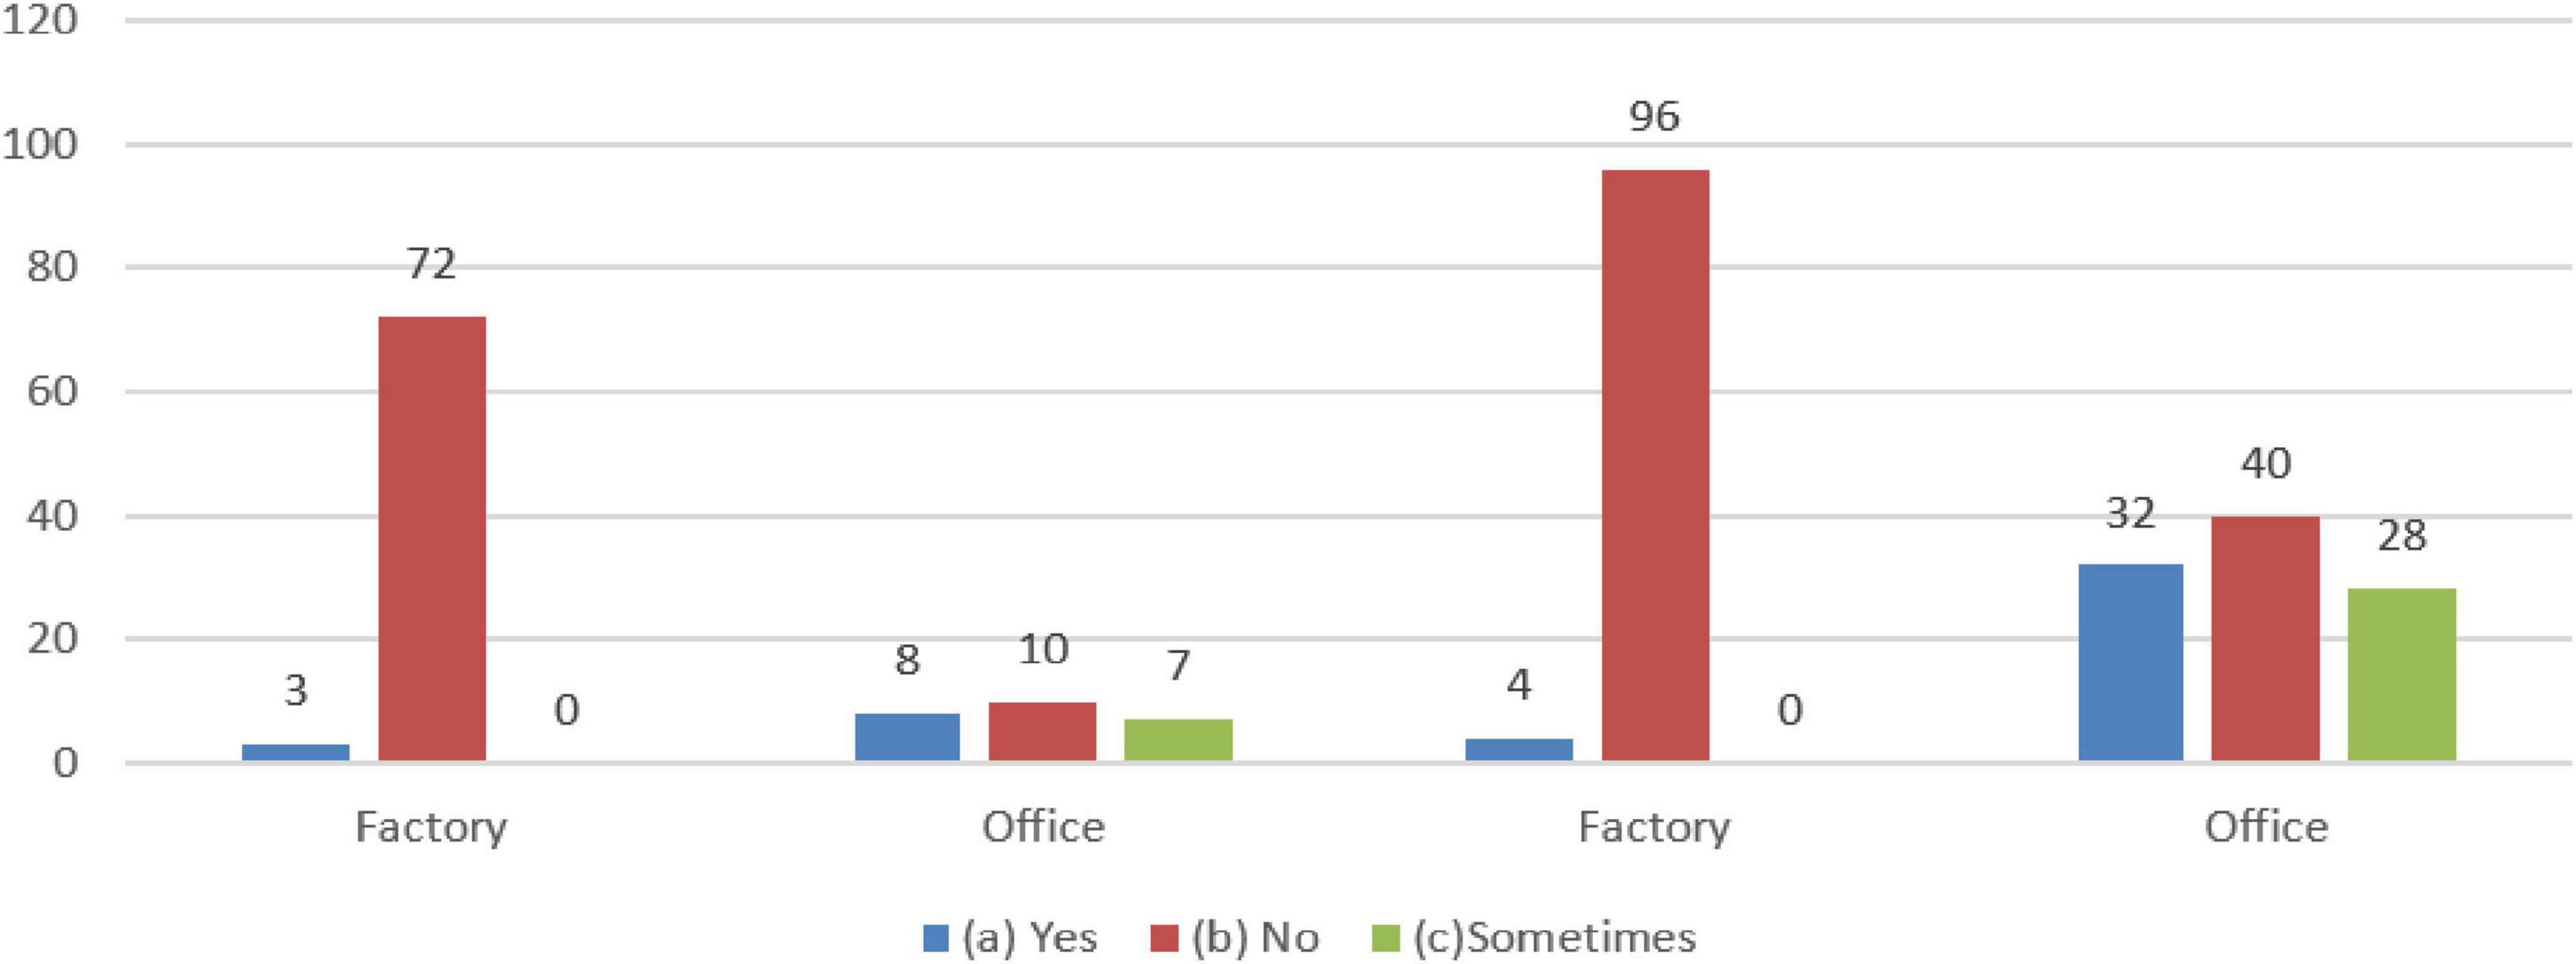
Figure 15. Showing training program (Source: Primary Data, 2020).
Interpretation: It may be concluded from the above Table 16 and Figure 16 that the atmosphere of a factory is more inspiring than that of an office.

Table 16. Showing motivation at the workplace.

Figure 16. Showing motivation at the workplace (Source: Primary Data, 2020).
Interpretation: The operation of every organization depends on discipline. Employee satisfaction in factories is higher than in offices, which can be observed clearly through Table 17 and Figure 17.

Table 17. Showing discipline.

Figure 17. Showing discipline (Source: Primary Data, 2020).
Interpretation: In any organization, grievances are common. Table 18 and Figure 18 depict that all industrial workers (100%) report that their complaints are promptly resolved. Therefore, workers in factories are happier when their complaints are resolved than those in offices.

Table 18. Showing response towards employee problem.

Figure 18. Showing response towards employee problem (Source: Primary Data, 2020).
Interpretation: From the above Table 19 and Figure 19, it is concluded that positive contact between the various sectors is reported by 100% of plant workers. Thus, it might be argued that manufacturing workers interact with one another and with their superiors to those of office workers.

Table 19. Showing contact among different sections.

Figure 19. Showing contact among different sections (Source: Primary Data, 2020).
Interpretation: As per Table 20 and Figure 20, it is clear that 72% of manufacturing workers are happy with the vacations; as a result, workers in offices and factories are extremely happy with the holidays that the company offers.

Table 20. Showing employee holiday.

Figure 20. Showing employees’ holiday (Source: Primary Data, 2020).
Interpretation: 100% of manufacturing workers are extremely delighted by the facilities offered by the company, as indicated in Table 21 and Figure 21. Therefore, the organization’s water facility is a source of satisfaction for both office and industrial workers.

Table 21. Showing employee opinion on water facility.

Figure 21. Showing employee opinion on water facility (Source: Primary Data, 2020).
Interpretation: In the plant, 13% of workers are happy with the restrooms provided by the company, whereas 87% are extremely satisfied. As a result, workers in offices and factories are happy with the conservancy facility, which is clearly observed from Table 22 and Figure 22.

Table 22. Showing employee opinion on conservancy facility.

Figure 22. Showing employee opinion on conservancy facility (Source: Primary Data, 2020).
Interpretation: It is evident from Table 23 and Figure 23 that both office and industrial workers are happy with the seating arrangement.

Table 23. Showing opinion about sitting facility.

Figure 23. Showing opinion about the sitting facility (Source: Primary Data, 2020).
Interpretation: As per Table 24 and Figure 24, employees in the office and manufacturing are therefore happy with the lighting system.
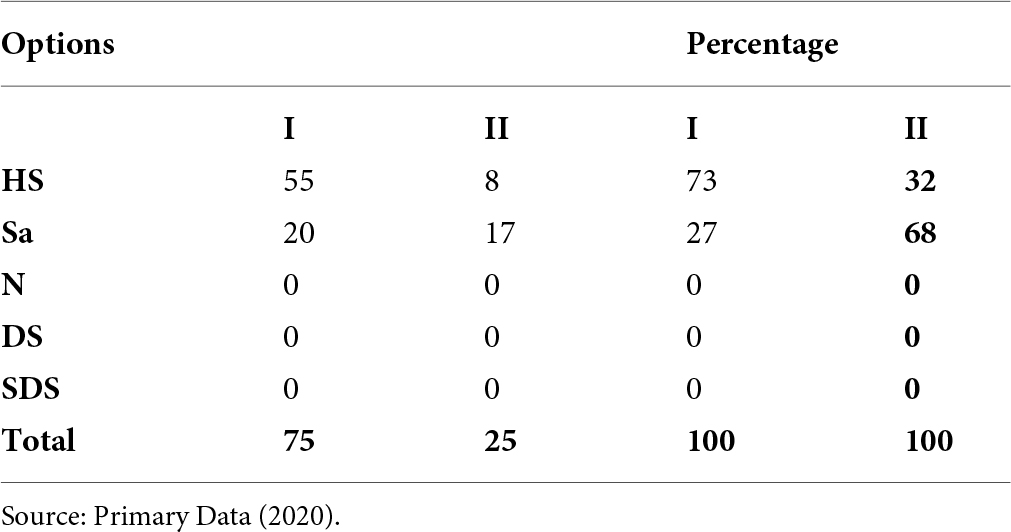
Table 24. Showing employee opinion on lighting.

Figure 24. Showing employee opinion on lighting (Source: Primary Data, 2020).
Interpretation: Three percent of workers at the factory are happy with the dustbins and basins. But the workers are dissatisfied with the organization’s spittoon facilities, which are depicted in Table 25 and Figure 25.

Table 25. Showing employee opinion on spittoon’s facility.

Figure 25. Showing employee opinion on spittoon’s facility (Source: Primary Data, 2020).
Interpretation: As per Table 26 and Figure 26, employees in the office and factory are completely happy with the first-aid facilities.

Table 26. Showing employee opinion on first-aid facility.

Figure 26. Showing employee opinion on first-aid facility (Source: Primary Data, 2020).
Interpretation: Employees of the office and factory have experience, as was previously mentioned. Therefore, it may be concluded that from the above Table 27 and Figure 27, most factory workers have a pleasant workplace. In the workplace, it’s also for personal fulfillment.

Table 27. Showing motive for service in the organization.

Figure 27. Showing motive for service in the organization (Source: Primary Data, 2020).
Hypothesis Testing Results
It is clear from Table 28 that the anticipated value is 44; however, the table value is 9.488. According to the calculation, the alternative hypothesis is accepted. Therefore, there is an impact.

Table 28. Showing analysis of the chi-square test.
Findings
It is a construction company focused on labor that has created an environment that is liked by the labor and employees and also shows respect toward the company. Owners are worshipped and have a sense of feeling of family. The company is supervised by different department supervisors. Workflow in the company is as follows: the report is submitted to managers by the workers and then to the owners. The place is diverse, as there are people from different places and states. And the company also considers disabilities. Meeting regularly is made mandatory to have good communication. Laborers are given rented homes with low rent and well-furnished homes. Allowances are given for long-distance traveling. Special initiatives like “Anganvadi” are taken for workers’ children. Master Plannery is awarded with ‘Master Year Man’ for recognizing the staff’s work. Gender equality is maintained, and through observation, it is seen that workers are quite efficient and creative.
Conclusion
By assigning tasks according to credentials and expertise and imposing explicit regulations for efficiency, the organization can enhance its structure. By having an HR manager in the workplace, concerns are handled, and employee input can be taken through a suggestion box. By scheduling education, training professional development can be supported. The well-being of employees is increased through having separate restrooms, uniforms, and free medical care. These preventive actions can be taken to take care of workers. Bonds are energized by celebrating birthday parties and fostering picnics. There is a strong priority towards Master Plannery as it prioritizes staff wellbeing and employee satisfaction. By addressing the concerns that have been highlighted, labor management effectiveness can reach 100%.
Funding
This research was received no financial support.
Conflict of interest
The authors report no conflict of interest concerning the materials or methods used in this study or the findings specified in this paper.
References
1. Zaid AA, Jaaron AAM, Bon AT. The impact of green human resource management and green supply chain management practices on sustainable performance: an empirical study. J Clean Prod. (2018) 204:965–79.
2. Seeck H, Diehl M-R. A literature review on HRM and innovation - taking stock and future directions. Int J Hum Res Manag. (2017) 28(6):913–44.
3. Bos-Nehles A, Renkema M, Janssen M. HRM and innovative work behavior: a systematic literature review. Pers Rev. (2017) 46(7):1228–53.
4. Omotayo FO. Knowledge management as an important tool in organisational management: a review of literature. Libr Phil Pract. (2015) 1:1–23.
5. Nwele JO, Akwawa UA, Ngene AN. Productivity and labour management relations in Nigeria. IJEDRI. (2014) 5(1):1–12.
6. Raj R, Srivastava KBL. The mediating role of organizational learning on the relationship among organizational culture, HRM practices and innovativeness. Manag Labour Stud. (2013) 38(3):201–23.
7. Dabiæ M, Ortiz-De-Urbina-Criado M, Romero-Martínez AM. Human resource management in entrepreneurial firms: a literature review. Int J Manpow. (2011) 32(1):14–33.
8. Golden TD, Veiga JF. The impact of the superior-subordinate relationship on the commitment, job satisfaction and performance of virtual workers. Leader Q. (2008) 19(1):77–88.
9. Kaupins G. Corporate governance and labour management: an international comparison. Acad Manag Perspect. (2006) 20(3):123–5.
10. Lepak DP, Liao H, Chung Y, Harden EE. A conceptual review of human resource management systems in strategic human resource management research. In: Martocchio JJ editor. Research in Personnel and Human Resources Management. Leeds: Emerald Group Publishing Limited (2006) p. 217–71.
11. Dambrin C. How does telework influence the manager–employee relationship? Int J Hum Res Dev Manag. (2004) 4:358–74. doi: 10.1504/IJHRDM.2004.005044
12. Gospel H, Pendleton A. Financial structure, corporate governance and the management of labor. Int J Hum Res Dev Manag. (2001):4.
14. Guest DE. Human resource management and performance: a review and research agenda. Int J Hum Res Manag. (1997) 8(3):263–76.
15. Brester C, Tregaskis O, Hegewisch A, Mayne L. Comparative research in human resource management: a review and an example. Int J Hum Res Manag. (1996) 7(3):585–604.
16. Jablin FM. Superior-subordinate communication: the state of the art. Psychol Bull. (1979) 86(6):1201.
17. Budhwar PS, Debrah YA. Human Resource Management in Developing Countries. London: Routledge (2013).
© The Author(s). 2026 Open Access This article is distributed under the terms of the Creative Commons Attribution 4.0 International License (https://creativecommons.org/licenses/by/4.0/), which permits unrestricted use, distribution, and reproduction in any medium, provided you give appropriate credit to the original author(s) and the source, provide a link to the Creative Commons license, and indicate if changes were made.