Executive summary
Text mining and nature language programming (NLP) have become important research areas. Text mining is the use of automated methods for exploiting the enormous amount of knowledge available in the biomedical literature (1). Text mining is a variation in a field called data mining that tries to find interesting patterns from large databases. Text mining, also known as intelligent text analysis, text data mining, or knowledge-discovery in text (KDT), refers generally to the process of extracting interesting and non-trivial information and knowledge from unstructured text (2, 3). Text mining is a young interdisciplinary field that draws on information retrieval, data mining, machine learning, statistics, and computational linguistics. Because most information (over 80%) is stored as text, text mining is believed to have a high commercial potential value. Knowledge may be discovered from many sources of information, yet unstructured texts remain the largest readily available source of knowledge (3). The text mining-NLP approach is becoming popular in the study of media coverage. Many scholars use this approach to automatically detect the sentiment of each article, thereby visualizing how the tone of reporting evolved throughout the year, on a party, firm, society, and newspaper level (4–6).
This task mainly focuses on topic I.2-News Articles and conducts certain analyses based on topic I.1-Congressional speech and information content. For News articles, this task selects the news titles in the New York Times journal from January 2020 to April 2021 for analysis. The news titles are gathered for each month. In this task, the most frequent words (central topics) covered in the whole period and each month are presented visually, the sentiment of news is analyzed, and the time change of the coverage on keywords is summarized and shown appropriately. For congressional speeches, this task selects the first congressional speech report each month from January 2020 to April 2021 for analysis. Therefore, both text analyses are based on monthly data from January 2020 to April 2021. This research also compares the two databases but found that their main focuses are not similar.
In brief, this task is devoted to answering the following questions:
1. What are the key focuses for New York Times news title and US congressional speech in the last 16 months, and what are the time-series change of these key focuses?
2. What is the time-series change in New York Times news sentiment?
3. How the central topics (COVID-19, US presidential election, etc.) change over time, and how are they distributed?
4. How does the result of this task look like? What other analyses are interesting for further analysis, and why are they not included in this task?
This task is done in the RStudio environment. An Intel Core i5-8250U CPU (1.60 GHz) laptop with 8 GB RAM is applied for carrying out all the calculations and analyses. Only the R (4.0.3 version) programming language is used. The R codes and the task-based database are available on the Github link https://github.com/XUAN-FENG9/Advanced-Financial-Analytics/. Appendix 1 presents the R codes used for this task, and in the codes, there are many vital notes for better understanding.
The research is outlined as follows. Section “Data selection and collection” briefly introduces how the data are collected and why the data are collected in this way. Section “Data cleaning” describes the steps for data cleaning. Based on the cleaned data, this research then moves into the main analysis—Section “Main analysis” illustrates the logic and methods used for text mining in this task, as well as presents and discusses the analysis results. The final Section “Evaluation and recommendation” evaluates the whole task, summarizes major imperfections and contributions, and presents insights into further analysis refining. All references listed in the References List are subject to the Harvard style.
Data selection and collection
This task mainly collects all the news titles of the New York Times journal from 1852 to 2021. All the data have been downloaded and saved as separate txt documents, 1 document for each month. However, only news titles from January 2020 to April 2021 are used for analysis because the whole data are so large that, in further data cleaning and analysis steps, the laptop cannot deal with all data in a short time. One contribution of this task is that the codes for this part (lines 28 to 65) can be used to extract the news titles of the New York Times journal in any specific time period by setting years (line 40) and months (line 43) in for-loops.
In this web-mining process, all paths (url) of news titles follow the hierarchic structure shown in Figure 1.
In the appendix R codes, lines 28 to 65 shows the R codes that are used to collect all the news titles from 1852 to 2021 and save/write them in a defined local directory—each month’s news titles are collected and written in one txt file. These codes work in the following ways. First, a “gettitle” function is defined (in code lines 34 to 36) to read and extract the news titles on each day’s webpage. Then, this whole data extract and collection work is mainly done by the “rvest” package through a triple loop—the most outside is a for-loop to read/open each year ‘s webpage; then, the second layer is a for-loop to read/open each month’s webpage on this year; and finally, the core is a “lapply” loop to read/open each day’s webpage on this month and extract and summarize the daily titles through applying the “gettitle” function (defined in code lines 34 to 36) on each day’s webpage. Besides, in loops, a “try” function is used for codes inside each loop, an approach that can jump some warnings and errors and continue the loop. For example, because some months do not have the news’ webpage, the original loop (loop on months from 1 to 12 for each year) will appear error and stop running when meeting these months. But this problem can be solved, and the loops can continue by packaging the codes inside a loop under a “try” function. Furthermore, in this work, the tkProcessBar function in the “tcltk” package is used to create a process bar, which can present the loop process and show how much percentage is finished when running the whole loop.
Similarly, this task also extracts and collects all the US congressional speech records data from 1951 to 2021 (82nd to 117th Congress) on the US government website. Each day’s record is separately saved as a txt file, and all days’ records during one Congress session are saved in a separate folder/directory. Code lines 88-119 record all codes that are needed to conduct the above work. According to demand, one can extract the congressional speech records in one or more Congress sessions by changing the session setting in line 74 (for sessions 104 to 117) or line 103 (for sessions 82 to 103). It is worth to be noticed that the website/url structures are different between period 1 (Congress session 82 to 103) and period 2 (Congress session 104 to 117), as shown in Figure 2. In this task, only the speech records on the first available day in each month from January 2020 to April 2021 are used for analysis because the laptop can only deal with limited data in a short time.
Data cleaning
Code lines 123 to 164 are used for data cleaning work in this task. The data cleaning process is conducted for both the “NYtimes” (New York Times news titles 2020-2021) and “congress” (US congressional speech records 2020-2021) corpora by the “tm” package. The data cleaning work is done in two steps. The first step (code lines 126-150) is a normal cleaning—transfer all words to lower case and remove all number, month, punctuation, English stop words, independent English letters, white spaces, and a vector of defined useless words (vector “remove” defined in code lines 126-129) that frequently appear in the corpus but are useless for further analysis. For example, words like “front page,” “title,” and “record” frequently appear in the news titles but do not have any meaning for text analysis.
The second cleaning step is to remove all non-English words, like messy strings and words in other languages. The English words are defined as all English words included in the “GradyAugmented” dictionary, which can be loaded by installing the “qdapDictionaries” package. For this task, three newly appeared words— “corona,” “coronavirus,” and “covid”—are added to the list/dictionary of English words. This cleaning work can be roughly done by listing all words in each corpus first, then finding strings that are not included in the list of English words—non-overlapped strings by comparing the list of words in each corpus and the list of English words through the “setdiff” function, and finally delete them. However, the “setdiff” function can only deal with less than 4,000 words at one time. But there are nearly 1 million words in each corpus—most words appear only one time. Therefore, in this task, instead of all words, only words that appear more than one time in each corpus are compared with the defined English dictionary, because less-frequency words that only appear one time have few impacts on further analysis in this task. There are nearly 6,000 words that appeared more than one time in each corpus—one- third of them appeared more than 5 times. So, I first filtered all words that appear more than 5 times, compared them with the dictionary, and deleted non-overlapped strings. Then, I set the frequency to 2 and redone the above job— filter words with frequency 2, compare them with the defined dictionary, and delete non-overlapped items.
Main analysis
Overview of data
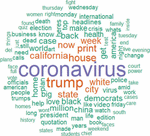
First, the word clouds for both corpora are generated by codes in lines 170 to 177. Figure 3 presents the word cloud based on all words covered in the New York Times news titles from January 2020 to April 2021. Figure 4 presents the word cloud based on all words in the US congressional speech records on the first day of each month in the same period. The result shows that the top-frequency words covered in these two corpora are different. For New York Times, the most frequent words covered in the news title in the last 14 months are, in sequence, “Coronavirus (covid/pandemic),” “Trump,” “election,” and “vaccine.”
These words just reflect the significant events that happened in the last 14 months—the outbreak of COVID-19, the US presidential election, and the introduction of vaccines for COVID-19. But the most frequent words covered in the US congressional speeches on the first day of the last 14 months include “House,” “committee,” “senate,” “congress,” and “The United States.” These words are no more than daily governmental/political terms and reflect few focuses on global events. But, these words do reflect the political property of congressional speeches. By comparison, the New York Times news focuses more on hotspot issues than congressional speeches.
The changes of focus over time
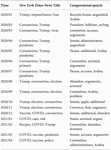
This work is to study the change of focus of both New York Times news titles and US congressional speeches by extracting the top 3 frequent words that appeared in these two corpora in each of the previous 16 months. The result is presented in Table 1.
From this table, we can see that the news titles of the New York Times closely and timely reflect hotspot issues. At the beginning of January 2020, the US kills Iran general Qassem Suleimani (7), and this event became the hottest issue at that time. The COVID-19 pandemic was outbroken widely worldwide since February 2020, and since then, the most important and frequent word covered in the news title of the New York Times is “coronavirus.” The focus changed to “Trump” 4 months before the US presidential election and lasted until the election result released in November 2020. After then, the global focus turned to popularize vaccination, and therefore, the word “vaccine” was more frequently covered in news titles. However, the top 3 frequent words covered in US congressional speeches varied significantly over months and did not reflect the hotspot issues. The only thing that can be reflected in these speeches is the US government’s long-term focus on Arabia because the word “Arabia” was usually among the top 3 frequent words covered in US congressional speeches.
Sensitivity analysis
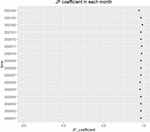
Deephouse (8) and Bansal and Clelland (9) introduced a modified Janis-Fadner imbalance coefficient to measure the tendency (positive or negative) of media coverages. Based on all news titles of the New York Times from January 2020 to April 2021, the Janis-Fadner (JF) coefficients for each month are presented in Figure 5.
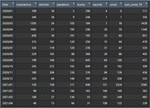
It can be seen that, in the past 16 months, the monthly Janis-Fadner coefficients vary from 0.94 to 0.98, and the total JF coefficient is very close to 1. This result means that in the last 16 months, the New York Times news covered much fewer negative words than positive words. So, the overall tendency of the last 16 months’ news report is positive. Code lines 214 to 238 are used to conduct the work of this part. Figure 6 presents how the Janis-Fadner coefficient is calculated in this task.
Keywords analysis
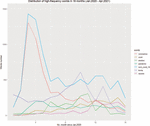
In this section (code lines 241-252), some keywords are defined, and their time changes of frequency are analyzed based on the New York Times news titles corpus. The “keywords” include “coronavirus,” “covid,” “pandemic,” “trump,” “election,” and “vaccine.” The three words— “coronavirus,” “covid,” and “pandemic”—all reflect the COVID-19 topic, so this task also uses the sum of these three words to represent the “COVID-19” topic. Figure 7 presents the appearance of each keyword over time, and Figure 8 plots the change of the frequency of these keywords according to their appearances in each month from January 2020 to April 2021.
The result shows that, among these keywords, the COVID-19-related words appeared more frequent in most months from January 2020 to April 2021, especially in March-April 2020, when the pandemic was first outbroken, and at the beginning of 2021, when the second wave was highly considered by the public. Two words—“Trump” and “election”—were most popular from September to November 2020, when the competition for the US president position came to the final stage and attracted many people’s consideration at that time. The word “vaccine” was more mentioned since the end of 2020, when many kinds of effective coronavirus vaccines were developed successfully and put into widespread use. This result is in line with the analysis result in Section “The change of focus over time”—the changing focuses of New York Times news titles reflect the change of global hotspot issues over time.
Evaluation and recommendation
This task conducted a series of text mining jobs mainly based on the New York Times news titles corpus from January 2020 to April 2021. This task also did some analyses based on the US congressional speeches during the same period. The result shows that compared with the focuses of US congressional speeches, the focuses of New York Times news titles better reflected the changing hotspot issues over time. Besides, although this task only uses a small sample of the whole database of both the two sources (New York Times and US congressional speeches) because of the limitation on running speed and time, one important contribution of this task is that the codes for this task can be used to download the New York Times news title and US congressional speech records among any time period since 1852. Based on the whole data, more interesting exploring works are worth to be conducted in the future. For example, it is interesting to explore the change of the title style (length of news titles) of New York Times news over a longer history (more than 50 years). It is also attractive to investigate the changing focuses on countries in US congressional speeches—the result can reflect the changing of the most concerned country of the US government over time. Both the above works should be based on analyzing massive data covering at least 50 years in order to make the analysis persuasive and meaningful. For conducting these works, enough time and a high-speed computer are needed.
Author contributions
The author confirms being the sole contributor of this work and has approved it for publication.
References
2. Rajman M, Besangon R. Text mining: natural language techniques and text mining applications. Data Min Reverse Eng. (1998) 50–64.
3. Gupta V, Lehal GS. A survey of text mining techniques and applications. J Emerg Technol Web Intell. (2009) 1:60–76.
4. Fortuny EJ, DeSmedt T, Martens D, Daelemans W. Media coverage in times of political crisis: a text mining approach. Expert Syst Appl. (2012) 39:11616–22.
5. Ampofo L, Collister S, O’Loughlin B, Chadwick A, Halfpenny PJ, Procter PJ. Text mining and social media: when quantitative meets qualitative and software meets people. Innov Digital Res Methods (2015) 161–92.
6. Salloum SA, Al-Emran M, Monem AA, Shaalan K. A survey of text mining in social media: facebook and twitter perspectives. Adv Sci Technol Eng Syst J. (2017) 2:127–33.
7. The Guardian.US kills Iran general Qassem Suleimani in strike ordered by Trump. [online]. (2020). Available online at: https://www.theguardian.com/world/2020/jan/03/baghdad-airport-iraq-attack-deaths-iran-us-tensions (accessed April 24, 2021).


