Introduction
The global financial landscape has been reshaped by the emergence of cryptocurrencies, with meme coins like Dogecoin and Shiba Inu gaining significant traction. These digital assets, characterized by extreme price volatility, community-driven narratives, and speculative appeal, attract a wide range of investors. However, the around-the-clock, information-saturated, and emotion-fueled trading environment of meme coins presents investors with unprecedented decision-making pressures, often leading to decision fatigue (DF). This psychological phenomenon, wherein prolonged or repeated decision-making depletes an individual’s mental resources, can result in impulsive or irrational choices that negatively affect trading behavior and investment performance (IP). While DF has been recognized in traditional financial contexts, its specific manifestations and mechanisms within the unique meme coin market remain underexplored.
This study seeks to bridge this gap by applying behavioral finance principles and quantitative methods to analyze how DF influences meme coin investors’ decision processes, trading behaviors [e.g., chasing gains and cutting losses, overtrading (OT)], and ultimately their IP. Understanding this dynamic is crucial both for advancing behavioral finance theory and for offering practical strategies to meme coin investors to improve decision-making and outcomes.
Research objectives
This study pursues four main objectives: to examine the determinants of DF among meme coin investors; to analyze how DF influences ITBs such as chasing gains and OT; to evaluate the impact of DF on IP; and to explore whether investment experience (IE) moderates these relationships.
Research questions
Correspondingly, the study addresses the following core questions:
• Q1: Is DF prevalent among meme coin investors, and what factors influence its severity?
• Q2: Does DF significantly increase ITBs (such as chasing gains, cutting losses, and OT) among meme coin investors?
• Q3: Does DF negatively affect the IP of meme coin investors?
• Q4: Does an investor’s experience level moderate the relationship between DF and investment behavior or performance?
• Q5: Do meme coin market volatility (MV) and community attention exacerbate investors’ DF?
Scope and limitations
This study focuses on individual investors in the meme coin market, with DF as the central explanatory variable. It considers investors in major meme coins (e.g., DOGE, SHIB), utilizing survey data for subjective measures and simulated market data for quantitative analysis. Key limitations include
• Data acquisition: The anonymous, decentralized nature of meme coin trading makes it difficult to obtain large-scale, precise individual transaction data. The study’s reliance on self-reported survey data and simulated scenarios may affect generalizability.
• Variable measurement: Psychological variables like DF and ITB are measured via self-report questionnaires, which could introduce biases (e.g., social desirability or recall bias).
• Market dynamics: The rapidly evolving nature of meme coin markets means the findings might be specific to the study period; future research is needed to verify if these patterns hold under different market conditions.
Research process
The study proceeds as follows. First, a comprehensive literature review establishes the theoretical foundations in DF, behavioral finance, and cryptocurrency (especially meme coin) investment behavior. Next, we detail the research design, including the conceptual framework, hypotheses, sampling methods, operational definitions of variables, data collection tools, and analytical approaches. We then describe the data collection (survey distribution and market data gathering) and the statistical analysis methods employed (descriptive statistics, reliability and validity tests, correlation, regression, and moderation analysis). Finally, we present the empirical results, discuss their implications for theory and practice, and offer conclusions along with recommendations and directions for future research.
Literature review
Decision fatigue theory
Definition and concept
Decision fatigue (DF), a concept from social psychology introduced by Roy F. Baumeister, describes the decline in the quality of decisions after an individual has made a long series of choices, due to the depletion of mental energy. Importantly, this is not physical tiredness but rather cognitive exhaustion from sustained self-control and decision-making. When individuals are faced with numerous options or frequent trade-offs, their capacity for careful decision-making wanes, often resulting in increasingly impulsive, irrational, passive, or risk-averse decisions. Baumeister et al. (1) famously demonstrated that DF impairs cognitive functions like attention, willpower, and rational thought. For example, a study of judicial decisions found that judges granted parole less frequently later in the day, suggesting a tendency to maintain the status quo when mentally fatigued (2). This implies that DF influences both the quality and the pattern of decisions, as individuals default to easier or more habitual choices when their mental resources are low(3).
Measurement and influencing factors
Decision fatigue (DF) is typically measured using psychological scales (e.g., a DF Scale or adapted ego-depletion scales) that assess subjective feelings of mental exhaustion, impulsivity, and declining decision quality. In experimental settings, researchers also measure it objectively by observing performance changes on prolonged decision tasks, such as increases in decision time, error rates, or shifts in risk preferences after many consecutive choices (4). Several key factors influence the onset and severity of DF:
• Decision frequency and complexity: Making decisions more frequently or facing very complex choices accelerates fatigue. For instance, high-frequency traders may experience DF more quickly than long-term investors.
• Time pressure: Urgent or time-sensitive decision-making depletes mental resources faster. The real-time nature of financial markets often imposes significant time pressure, contributing to quicker fatigue onset (5).
• Information overload: An abundance of information common in financial contexts can overwhelm cognitive processing and hasten DF (6).
• Emotional state: Negative emotional states (e.g., anxiety, stress) consume additional cognitive resources, making individuals more susceptible to fatigue. MV-induced fear and greed can exacerbate this effect (7).
• Individual differences: Personal traits such as self-control strength, decision-making style, and fatigue resilience, as well as physical factors like sleep and nutrition, can affect one’s resistance to DF (3, 8).
Applications and empirical evidence
Decision fatigue (DF) has been documented across various domains. In the judicial field, as noted, judges’ decisions are affected by fatigue, leading to more status quo rulings later in the day (2). In medicine, doctors have been found to prescribe antibiotics more frequently later in their shift, implying DF can lead to less optimal, more heuristic-driven choices (9). In consumer behavior, shoppers faced with too many choices may either make no decision or choose default options, reflecting DF in purchasing contexts (10). In education, students’ cognitive performance can decline after completing multiple demanding tasks (11).
In financial decision-making, DF is particularly relevant because investors constantly process vast amounts of information and must make complex decisions under uncertainty. This sustained cognitive load can rapidly deplete decision-making resources, leading to poorer financial choices and increased susceptibility to emotional biases (12). Empirical studies in finance suggest that prolonged decision-making impairs investment quality: for example, institutional investors’ bidding behavior may change later in the day, with reduced accuracy and a preference for simpler decisions (13). High-frequency traders, when fatigued, tend to rely on mental shortcuts instead of thorough analysis (14). DF might also manifest as procrastination in portfolio reviews or an inability to act on new information, leading to missed opportunities or knee-jerk reactions to market shifts (15).
Cryptocurrencies and meme coins
Cryptocurrency market characteristics
Cryptocurrencies are digital assets built on blockchain technology, and since the inception of Bitcoin in 2009, they have grown into a multi-trillion-dollar global market. Key characteristics of cryptocurrency markets include: Existing empirical work also treats cryptocurrencies as financial assets with distinctive return, diversification, and safe-haven characteristics (16–18).
• Decentralization: Most cryptocurrencies operate without a central authority, instead relying on distributed ledger (blockchain) consensus mechanisms.
• Transparency and pseudonymity: All transactions are recorded publicly on the blockchain, but participants typically use pseudonymous addresses, providing a mix of openness and privacy.
• High volatility: Cryptocurrency prices often fluctuate dramatically, offering potential for high returns but also entailing significant risks.
• 24/7 trading: Unlike traditional markets, crypto markets never close, requiring constant vigilance from investors.
• Community-driven dynamics: Many crypto projects, especially meme coins, are heavily influenced by online communities and social media sentiment.
• Emerging regulatory frameworks: As a relatively new asset class, cryptocurrencies operate in evolving regulatory environments, and market efficiency may differ from that of traditional financial markets.
Rise of meme coins
Meme coins are a subset of cryptocurrencies born from internet jokes and pop culture, yet some (e.g., Dogecoin, Shiba Inu, and Pepe) have reached sizable market capitalizations. Their dynamics are driven less by fundamentals than by speculative demand and community narratives. Hallmark features include high speculation amplified by social media buzz; extreme volatility with abrupt, outsized swings; community-driven momentum on Reddit, X, and Telegram; fear of missing out that pulls investors into rapid entries; and heavy information noise that obscures signal. Because attention and sentiment can pivot quickly, prices may surge or collapse within hours. Staying continuously engaged with community chatter becomes a de facto requirement for participants, a cognitively taxing condition that can induce DF. Waves of online hype pressure investors to make frequent buy/sell decisions, depleting self-control and judgment (19).
Academic work on meme coins is emerging. Studies link social-media sentiment to volatility and price surges [e.g., positive Twitter tone preceding Dogecoin spikes; Kyriazis et al. (20)] and interpret run-ups as sentiment-driven bubbles and herding rather than intrinsic value (21). Behavioral-finance perspectives document classic biases among crypto traders, including the disposition effect and herding (22). Yet research rarely examines the cumulative mental strain imposed by continuous, high-frequency choice DF despite its plausibility in always-on, hype-intensive markets. This study addresses that gap by integrating decision-fatigue theory into meme-coin investing, asking how the market’s unique stresses elevate fatigue and, in turn, shape irrational trading and performance.
Recent studies focusing on cryptocurrency markets in emerging economies and Asian contexts further highlight the behavioral dynamics of retail investors in highly speculative digital assets. For example, research examining Asian cryptocurrency markets finds that retail investors tend to rely heavily on social media signals and peer sentiment when making trading decisions, particularly during periods of extreme volatility. Such environments amplify psychological pressures and may increase susceptibility to cognitive biases and DF.
Similarly, empirical studies on retail cryptocurrency investors in emerging markets suggest that speculative assets such as meme coins attract investors with heterogeneous experience levels, where inexperienced participants often exhibit stronger behavioral biases and higher trading intensity. These findings reinforce the importance of examining psychological constraints such as DF within the broader context of retail-dominated cryptocurrency markets.
Behavioral finance and investment behavior
Core concepts of behavioral finance
Behavioral finance integrates psychological insights into economic models to explain investor behavior and market anomalies (23–26). Behavioral finance challenges this view, arguing that cognitive biases and emotions systematically influence decisions (27), leading to persistent anomalies and inefficiencies (26). Key concepts include:
Behavioral finance recognizes that investors face bounded rationality, limited cognition, time, and information, so they satisfice rather than optimize. Empirical research further shows that investors often exhibit systematic behavioral patterns when realizing gains and losses. For example, investors tend to sell winning assets too quickly while holding losing assets too long, a phenomenon widely known as the disposition effect (28, 29). Heuristics introduce systematic cognitive biases: the disposition effect (selling winners too early, holding losers), herding (following the crowd/FOMO), overconfidence (excessive trading and risk), anchoring (fixating on reference prices), and framing effects (choices shifting with presentation) (30). Emotions such as fear, greed, and regret further distort judgment, fueling panic selling in crashes and exuberant buying in bubbles (31). By integrating these psychological forces, behavioral finance explains anomalies like bubbles, heavy trading, and volatility clustering, and it informs decision processes that accommodate human limitations.
Irrational trading behaviors
Irrational trading behaviors (ITBs) are systematic departures from optimal choice. Chasing gains and cutting losses induces buy-high/sell-low cycles that lock in poor returns, a pattern consistent with cumulative prospect theory and reference-dependent risk evaluation (32) OT often fueled by overconfidence and action bias, raises costs and degrades performance (33, 34). Herding substitutes crowd signals for analysis (35), inflating bubbles and deepening crashes (36). Short-termism fixates on noise and rumor, abandoning longer-horizon plans.
A cross-cutting driver is DF: as mental energy wanes, investors lean on heuristics and affect, mistaking momentum for information, yielding to social pressure, or trading merely to relieve anxiety. In meme-coin markets, which are volatile, always-on, and saturated with social media cues, fatigue accumulates quickly, prompting knee-jerk entries after spikes and panicked exits on dips. Recognizing these patterned errors and their dependence on cognitive depletion supports safeguards such as pre-commitment rules, scheduled breaks, and throttled trade frequency to preserve judgment and, ultimately, investment outcomes.
In summary, the literature suggests that DF could play a significant role in the high-turnover, high-volatility world of meme coin trading. Investors in this space are likely subject to a combination of cognitive overload (due to the sheer volume of information and continuous market activity) and a gauntlet of behavioral biases. Our study’s theoretical foundation therefore combines DF theory with known behavioral finance concepts to hypothesize how these elements interact in the meme coin domain.
Research hypotheses
Building on the literature above, we propose the following hypotheses for our empirical investigation:
• H1: Higher levels of DF lead to more pronounced ITBs among meme coin investors.
∘ H1a: DF is positively associated with the tendency to chase gains and cut losses.
∘ H1b: DF is positively associated with the frequency of OT.
• H2: Higher levels of DF lead to worse IP among meme coin investors.
• H3: Meme coin MV exacerbates investors’ DF (i.e., there is a positive relationship between MV and reported DF).
• H4: IE moderates the impact of DF on meme coin investment behavior and outcomes. (Experienced investors are more resilient to the negative effects of DF.)
• H5: High social media attention (SMA) on meme coins increases investors’ DF.
Methodology
Research framework
This study employs an empirical quantitative approach to investigate the causal relationships and correlations between DF, meme coin investment behavior, and performance. The research framework (depicted in Figure 1) outlines the key independent, dependent, moderating, and control variables in our model. The central independent variable is DF. The primary dependent variables are ITB with subcomponents Chasing Gains/Cutting Losses (CGCL) and OT and IP. IE is included as a moderating variable that may buffer or alter the effect of DF on behaviors and performance. In addition, several control variables are incorporated: namely, MV, SMA, and key demographic factors (such as age, gender, education, and income) (see Figure 1).
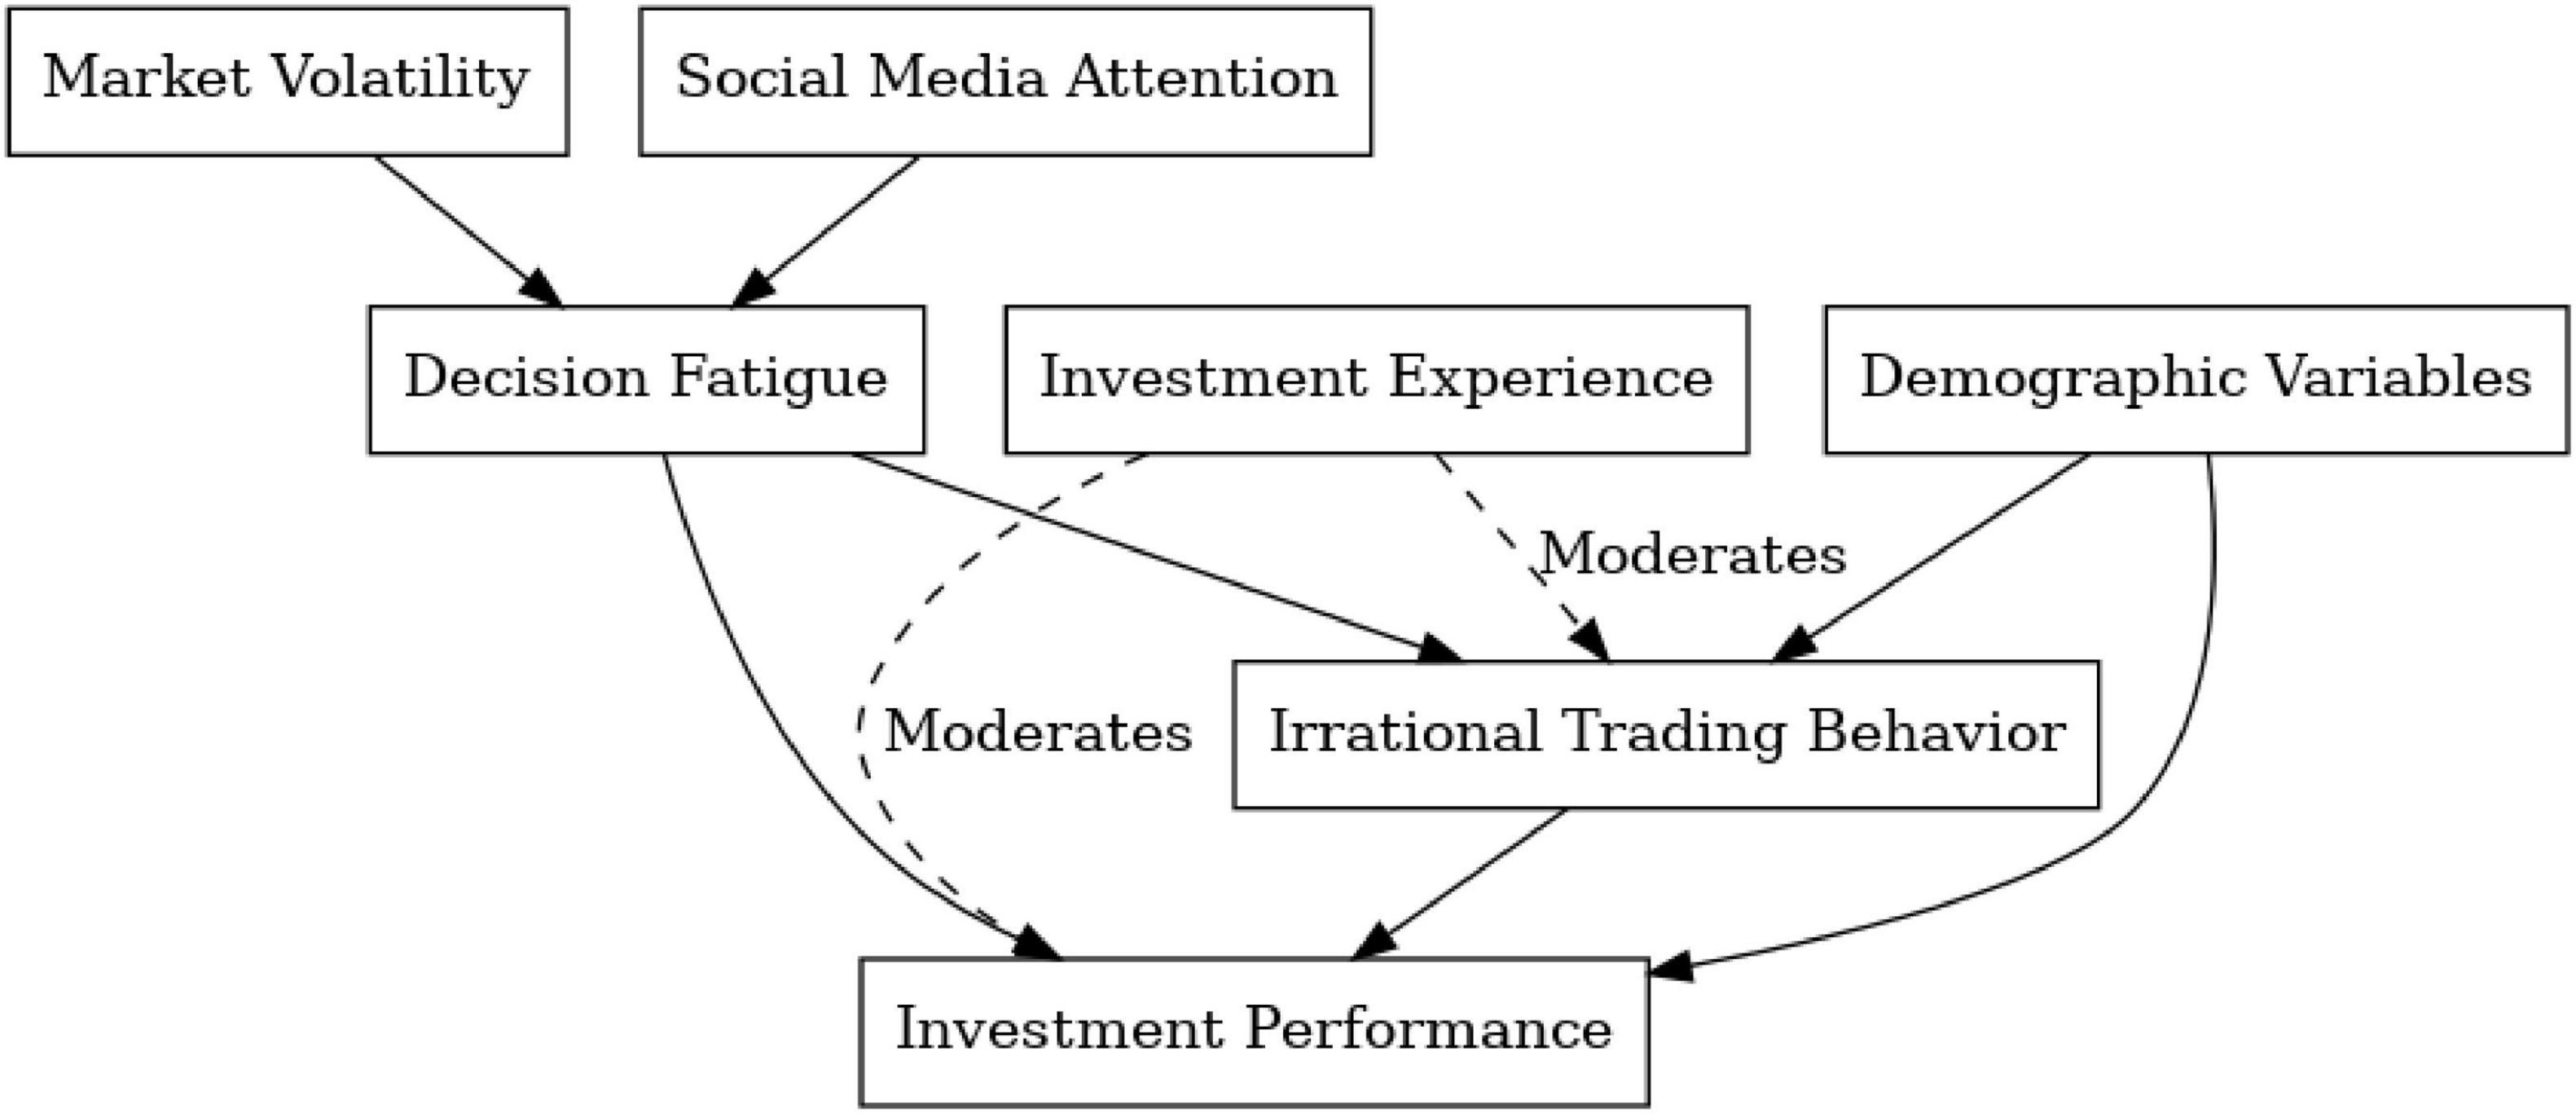
Figure 1. Proposed research framework. Note: The conceptual model depicts decision fatigue (DF) as the independent variable influencing irrational trading behavior (ITB) and investment performance (IP). MV, social media attention (SMA), and demographic factors are included as control variables that may also impact trading behavior and performance. Investment experience (IE) serves as a moderating variable, weakening the effect of DF on both ITB and IP (indicated by the dashed “Moderates” arrows). Arrows show hypothesized causal directions among variables.
Research subjects and sampling
The target population for this study is individual investors active in the meme coin market. Given the online and community-centric nature of meme coin investing, we employed a combination of snowball sampling and convenience sampling to reach participants. An online survey was distributed via cryptocurrency-focused social media groups and forums (including Telegram chat groups, Discord servers, Reddit communities, and Twitter/X). Respondents were encouraged to share the survey link with other meme coin investors in their network to broaden the reach (snowball technique).
Our aim was to collect between 300 and 500 valid survey responses to ensure a robust sample for statistical analysis. The final sample consisted of N = 500 individual meme coin investors. To supplement the survey data, we also attempted to gather anonymous trading data from cryptocurrency exchanges; however, due to privacy and data limitations, the analysis primarily relies on self-reported and simulated data.
Operational definitions and measurement of variables
Decision fatigue (DF)
Decision fatigue (DF) is the depletion of mental energy that lowers decision quality after many or difficult choices. We measure DF with investment-context Likert items (1–7) capturing exhaustion and impaired focus during meme-coin trading (e.g., “After many trading decisions I feel mentally worn out”). Higher composites indicate greater fatigue.
Irrational trading behavior (ITB)
Two focal tendencies: CGCL, impulsive buying after run-ups and quick selling on declines, and OT, excessive trade frequency/short holding. Items are rated 1–7; subscales are analyzed separately and optionally combined into an ITB index.
Investment performance (IP)
Self-reported annual return (%) serves as the main outcome. Where feasible, we cross-validate with volunteered trading records or market simulations. IP is treated as a continuous variable.
Investment Experience (IE)
Investment Experience (IE) reflects familiarity with markets, crypto, and meme coins. We build a composite from years in each domain and typical daily monitoring time. Theory predicts higher IE buffers DF’s adverse effects on behavior and performance.
Market volatility (MV)
Standard deviation of daily returns for major meme coins (e.g., DOGE, SHIB, PEPE) over the study window.
Social media attention (SMA)
A composite of X/Twitter mentions, Google Trends, and Reddit/Telegram activity; we also record respondents’ self-reported consumption of meme coin content.
Demographics
Age, gender (coded for regression), education, occupation, and income, given their potential links to trading style, risk tolerance, and susceptibility to fatigue.
Data collection procedures
Questionnaire design and distribution
We developed an online questionnaire using Google Forms (with an option for respondents to remain anonymous). The survey consisted of several sections:
1. Consent and introduction: Participants were informed about the study’s academic purpose, assured of anonymity, and asked for consent to use their responses for research.
2. DF scale: A set of statements measuring the investor’s feelings of mental fatigue and decision quality during trading, as described above.
3. ITBs: Items measuring CGCL and OT tendencies.
4. IP: Questions on self-reported gains/losses.
5. IE and demographics: Questions on trading experience, plus age, gender, etc.
6. Social media and market perception: Questions about how closely they follow meme coin communities and their perception of recent MV.
The survey was first pilot-tested with a small group of 10 crypto investors to ensure clarity and relevance. After minor revisions for clarity, it was distributed broadly. We posted the survey link in various meme coin forums and social media communities, often with the help of community moderators or influential members. To maximize honesty, we emphasized that there were no “right or wrong” answers and that even negative performance or irrational behaviors were valuable data for our research.
Within a 3-week data collection window, we received 547 responses. After filtering out incomplete responses and those that failed attention-check questions embedded in the survey, we retained 500 valid responses for analysis.
Market and social data collection
To complement the subjective data, we gathered objective data on MV and social media trends during the period corresponding to the survey. Historical price data for key meme coins were downloaded to compute volatility metrics (daily return standard deviations). For SMA, we utilized the Twitter application programming interface (API) to count mentions of relevant keywords and Google Trends to gauge relative search interest in meme coins. These data were matched to the timeframe of respondents’ activity to contextualize their experience (for instance, if a respondent reported on behaviors over the “past year,” we looked at volatility and social media indices over that year).
Where possible, we also collected trading records from a subset of participants who volunteered such data (some provided read-only API keys to their exchange accounts for research purposes). This allowed us to validate the relationship between self-reported and actual performance for a small subsample and to compute objective performance metrics like return on investment (ROI) for them. However, this subset was not large enough to use exclusively for performance analysis, so self-reported performance remains the primary measure for IP in the main analysis.
We used a combination of statistical software for analysis, primarily Python (with libraries such as Pandas, NumPy, SciPy, and Statsmodels) and SPSS for cross-verification of results. The analysis proceeded in several steps:
Descriptive statistics
We first computed summary statistics to characterize the sample and each key variable. This included frequency distributions for categorical variables (e.g., gender, education) and means, standard deviations, and ranges for continuous variables (e.g., DF scores, trading frequency, performance outcomes). We also examined skewness and kurtosis to understand the distribution shapes, given that variables like performance might be non-normally distributed (e.g., a few individuals with very high gains or losses could skew the distribution).
Reliability and validity of scales
For the multi-item scales (DF and ITB indices), we assessed internal consistency using Cronbach’s alpha. The DF scale items had a Cronbach’s α of 0.88, and the ITB items (combining CGCL and OT questions) had α = 0.85, both exceeding the common 0.70 threshold for acceptable reliability. We also conducted an exploratory factor analysis to ensure that the items intended to measure distinct constructs (DF vs. irrational behavior) indeed loaded onto separate factors, confirming construct validity. A confirmatory factor analysis (using a structural equation modeling approach) indicated that the hypothesized measurement model had acceptable fit indices, further supporting validity.
Correlation analysis
Pearson correlation coefficients were computed to examine the bivariate relationships between all key variables: DF, CGCL, OT, overall ITB, IP, IE, MV, and SMA. This provided an initial test of our hypotheses H1, H2, H3, and H5 at the correlational level. We report these correlations in Table 1 (see Table 2 below for descriptive stats and Table 1 for correlations). Notably, DF was expected to positively correlate with irrational behaviors and negatively with performance (H1 and H2). We also expected MV and SMA to positively correlate with DF (H3, H5) and IE to negatively correlate with DF and positively with performance (these correlation patterns would lay the groundwork for the moderation hypothesis H4).
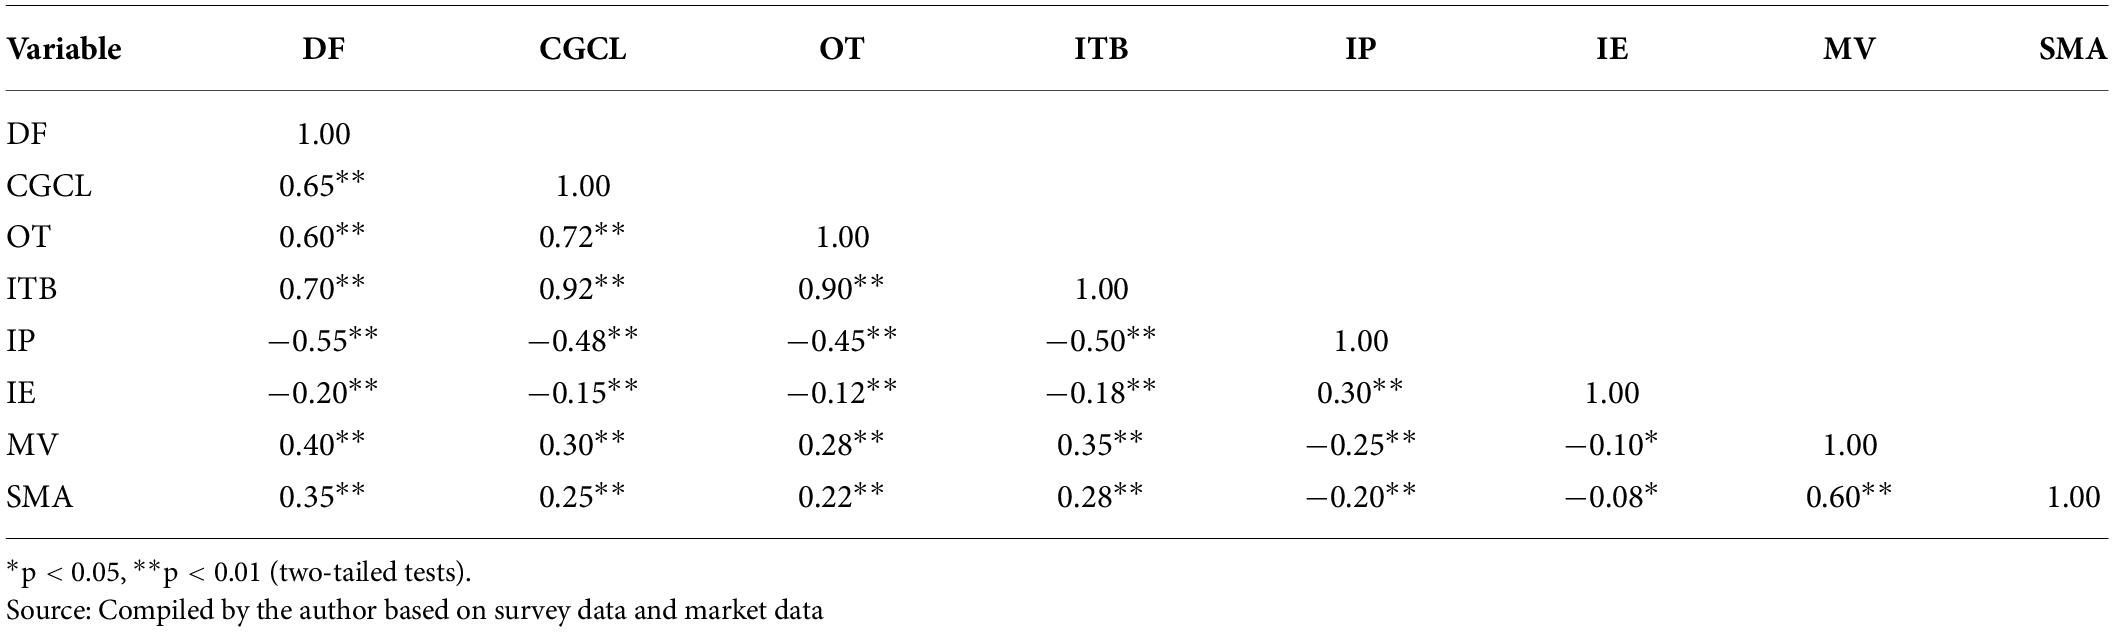
Table 1. Correlation matrix of main variables (N = 500).
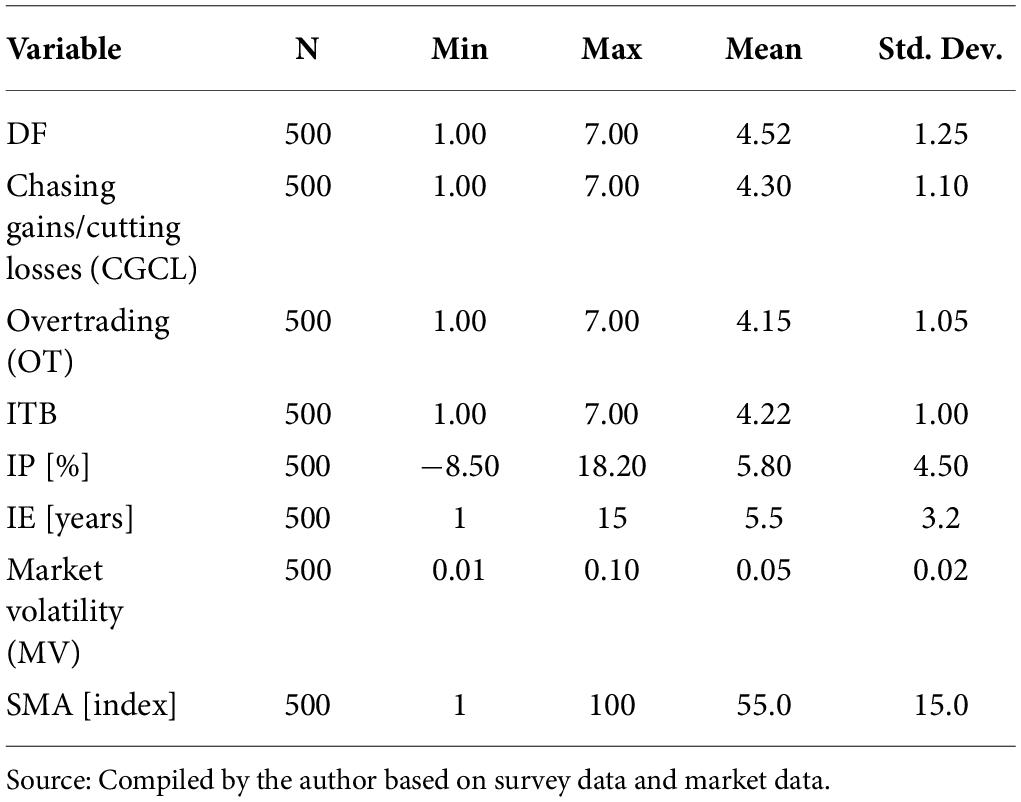
Table 2. Descriptive statistics of main variables.
Regression analysis
We conducted multiple regression analyses to test the direct effects and the moderation effect formally:
• Direct effects: We ran separate multiple regression models with ITB and IP as dependent variables. In each model, DF was the key independent variable. We included control variables (MV, SMA, and demographics) as additional independent variables. For example, the ITB model: ITB = β0 + β1DF + β2IE + β3(DF * IE) + Control Variables + ε IP = γ0 + γ1DF + γ2IE + γ3(DF * IE) + Control Variables + ε
• These regressions test H1 and H2 (while accounting for other factors). We examine the statistical significance and standardized coefficients to interpret the strength of effects.
• Moderation effect: To test H4 (that IE moderates the effect of DF), we used hierarchical regression. We first entered the main effects of DF and IE (and controls), then added an interaction term DF × IE. A significant interaction term would indicate moderation. We also probed the interaction by examining the effect of DF on outcomes at different levels of IE (e.g., one standard deviation above and below the mean experience).
• Robustness checks: We explored alternative model specifications as robustness checks. For instance, given that the self-reported performance data had some outliers, we ran a Tobit regression (censored regression), treating performance beyond certain thresholds as censored, to see if results held. We also tested models using an alternative measure of DF (e.g., a binary high/low fatigue indicator) and found consistent patterns.
Path analysis (exploratory)
Although not a core part of our hypotheses, we conducted an exploratory path analysis to see if ITB mediates the effect of DF on performance. This was motivated by the idea that fatigue might harm performance indirectly by causing poor trading decisions. Using a simple mediation model: DF → ITB → IP, we found some evidence that a portion of DF’s impact on performance is indeed mediated through irrational behavior (the Sobel test for mediation was significant). However, DF still retained a direct negative effect on performance even when accounting for the mediator, suggesting both direct and indirect pathways.
All statistical tests were evaluated at a significance level of 0.05 (two-tailed). We report the key findings with their significance levels in the Results section below, including any relevant figures and tables to illustrate the patterns.
Procedures followed research ethics: voluntary, anonymous participation with informed consent and withdrawal rights. No identifying data were collected; optional contacts were stored separately. Responses were encrypted; reporting is aggregated/anonymized. Risks were minimal. The study received Institutional Review Board (IRB) approval. Sources follow APA; analysis code and outputs are retained for verification and reproducibility.
Results
Sample characteristics
We obtained 500 valid survey responses from meme coin investors. Table 3 summarizes the demographic characteristics of the sample. The sample was predominantly male (52% male, 48% female) and relatively young on average, with 70% under the age of 35. A majority (about 60%) held at least a bachelor’s degree. In terms of income, the respondents were distributed across income levels, with about 50% earning below 60k (in local currency units) per month.
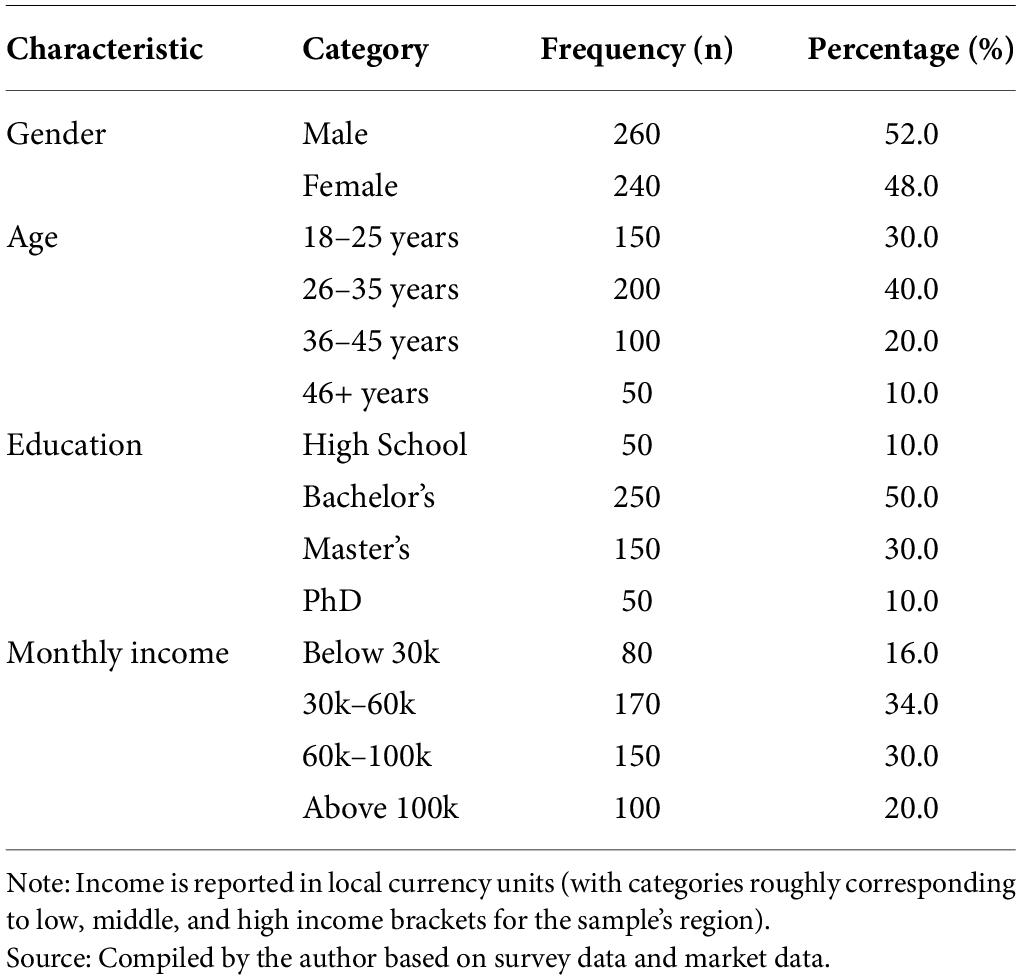
Table 3. Demographic characteristics of the sample (N = 500).
This profile of respondents is fairly typical of the meme coin community: relatively young, tech-savvy individuals, with a substantial portion having higher education. The average self-reported overall IE was about 5.5 years (SD = 3.2 years), indicating that while some respondents are new to investing, others have considerable experience (including in traditional markets or broader crypto markets). However, specific experience with meme coins was often shorter (many got involved in the past 1–2 years during hype cycles). This diversity in experience provides a useful range for analyzing our moderation hypothesis.
Scale reliability and validity
Before testing the main hypotheses, we confirmed the reliability and validity of our key composite measures:
• The DF scale (comprised of 5 items) had a Cronbach’s α of 0.88, indicating good internal consistency.
• The ITB index (combining 4 items covering CGCL and OT behaviors) had a Cronbach’s α of 0.85, also indicating good reliability.
• Factor analysis supported that the DF items loaded strongly on one factor, while the ITB items loaded on a separate factor, with minimal cross-loadings. This suggests our measures are capturing distinct constructs as intended.
Descriptive statistics of key variables
Table 2 presents the descriptive statistics for the main quantitative variables in the study: DF, CGCL, OT, the composite ITB, IP, IE, MV, and SMA. All variables are based on the full sample (N = 500).
From Table 2, we see that on average, respondents reported a moderate level of DF (mean ∼4.52 on a 7-point scale). The average scores for ITBs (around 4.2) suggest that such behaviors are also moderately prevalent among these investors. The mean self-reported annual IP was +5.80%, but with a large standard deviation (4.5) and a range from about −8.5% (significant loss) to +18.2% (significant gain). This indicates high variability in outcomes consistent with the risky nature of meme coin investments.
The MV during the period was on average 5% daily (which is quite high compared to traditional assets but typical for crypto), and the SMA index averaged 55 on a 1–100 scale, reflecting considerable buzz.
Correlations between variables
To test the bivariate relationships hypothesized (H1 through H5), we examined the Pearson correlation matrix for all main variables. Table 1 displays these correlations, with statistical significance indicators.
Several important patterns emerge from Table 1:
• Decision fatigue (DF) has a strong positive correlation with ITBs. Specifically, DF correlates with CGCL at r = 0.65 and with OT at r = 0.60 (both p < 0.01). The correlation between DF and the overall ITB index is r = 0.70 (p < 0.01). These substantial correlations support hypothesis H1 at the bivariate level: investors who report higher DF also tend to engage more in chasing gains, cutting losses, and OT. This aligns with the expectation that fatigue leads to more impulsive and reactive trading.
• Decision fatigue (DF) is negatively correlated with IP at r = −0.55 (p < 0.01). Thus, higher fatigue is associated with worse self-reported returns, supporting hypothesis H2. Investors who manage to maintain lower fatigue levels tend to have better outcomes, whereas those who feel mentally exhausted by trading tend to underperform.
• Market volatility (MV) shows a positive correlation with DF (r = 0.40, p < 0.01). In periods of higher volatility, investors report greater fatigue, which is intuitive and supports H3. Additionally, MV has positive correlations with irrational behaviors (e.g., r = 0.35 with ITB), implying volatile markets might directly or indirectly encourage more irrational trading.
• Social media attention (SMA) is also positively correlated with DF (r = 0.35, p < 0.01). This supports H5, suggesting that when meme coins are heavily discussed on social platforms (creating more noise and perhaps pressure to act), investors experience higher fatigue. SMA also correlates positively with irrational trading (r = 0.28 with ITB), hinting that high social media buzz could be associated with more reactive trading behavior.
• Investment experience (IE) has a negative correlation with DF (r = −0.20, p < 0.01) and a positive correlation with performance (r = 0.30, p < 0.01). Experienced investors tend to be less fatigued and achieve better outcomes, which is consistent with the notion that experience may impart better coping strategies or skills. These correlations set the stage for hypothesis H4, which will be tested more directly via moderation analysis.
In summary, the correlation analysis provides initial confirmation for all hypothesized relationships. However, correlation alone does not prove causation or account for interdependencies, so we proceed to regression analyses to control for overlapping factors and test the hypotheses more rigorously.
Impact of decision fatigue on irrational trading behavior (H1)
We first examine whether DF predicts the degree of ITB, controlling for other variables. Table 4 presents the results of a multiple regression with the dependent variable CGCL, and Table 5 for the dependent variable OT. In each model, DF is the key predictor, with controls for IE, MV, SMA, and demographics (age, gender, education, and income).
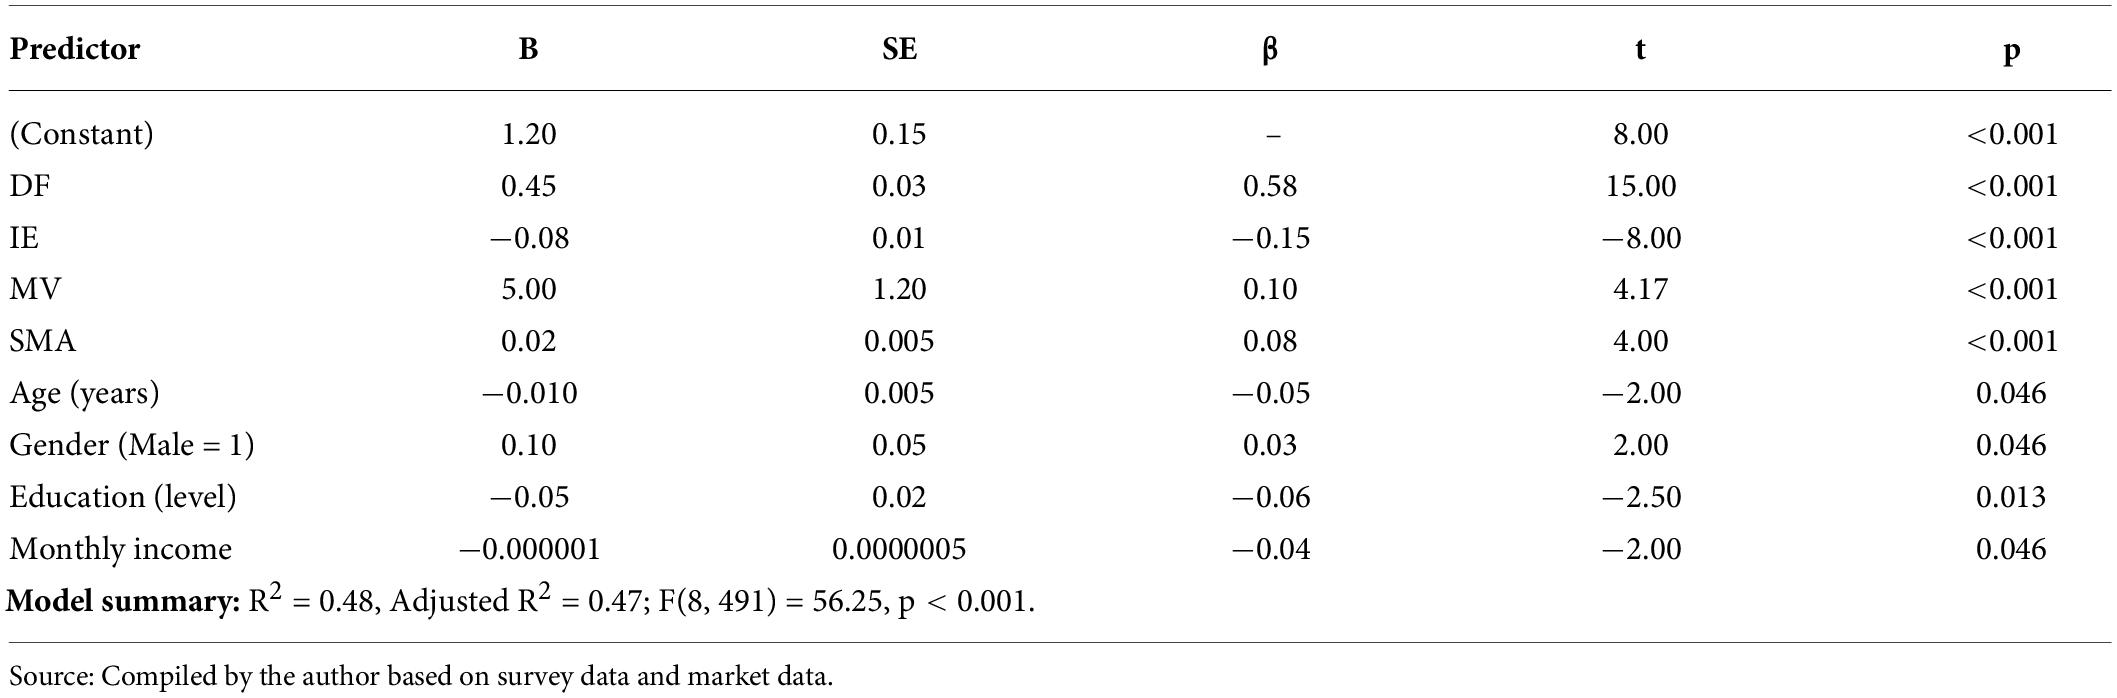
Table 4. Regression analysis predicting CGCL from DF and controls.
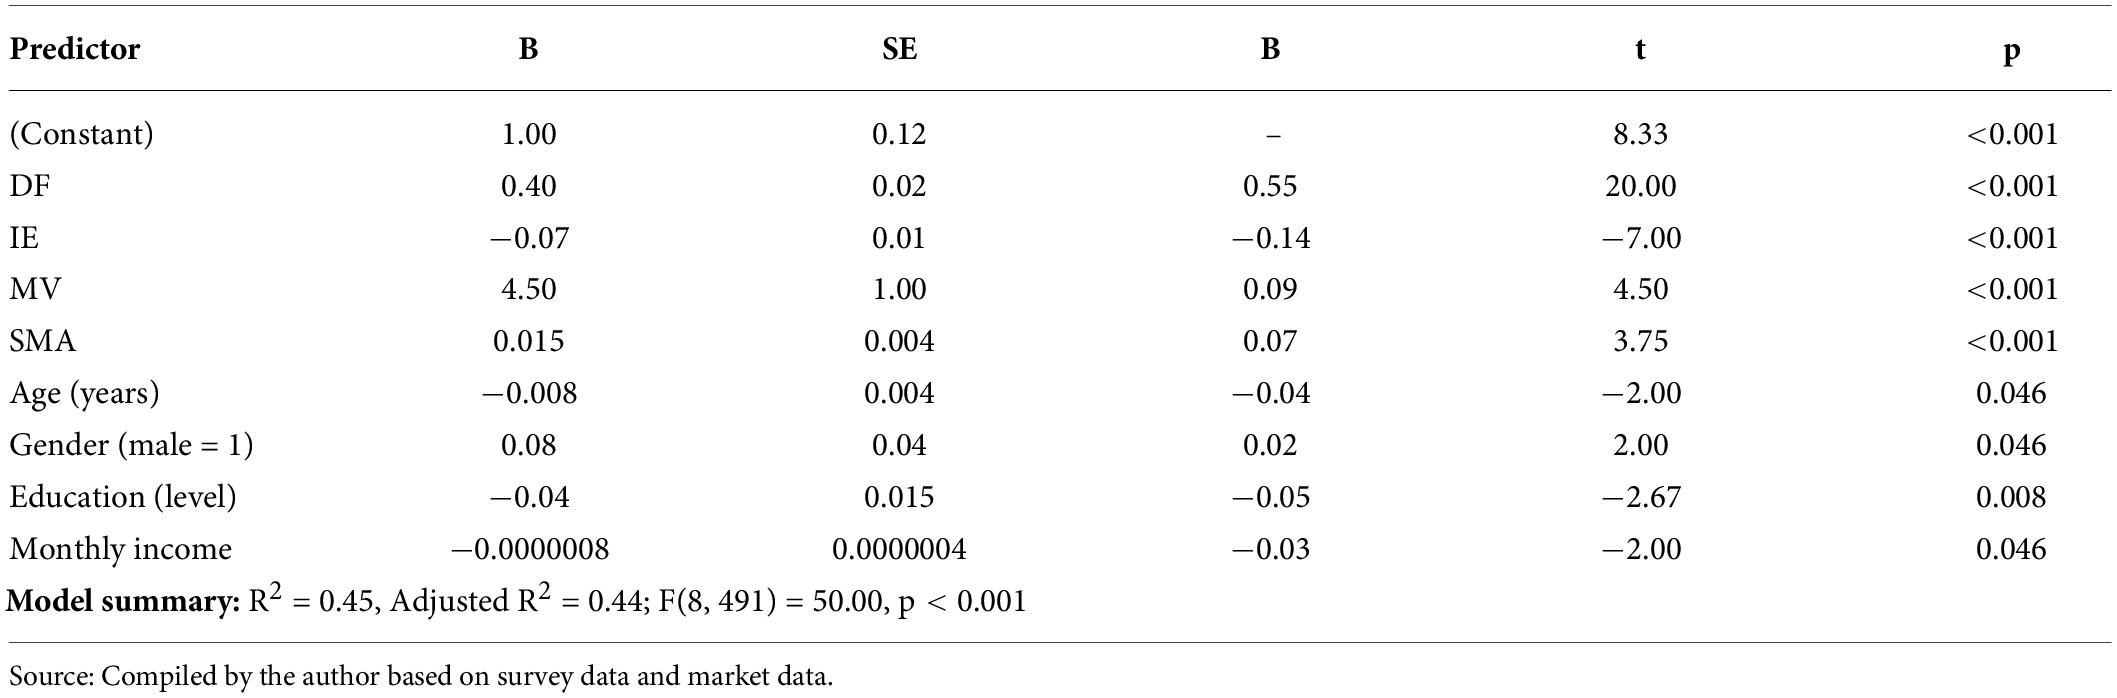
Table 5. Regression analysis predicting OT from DF and controls.
In both Tables 4 and 5, DF emerges as a highly significant predictor:
• For CGCL, DF has β = 0.58 (p < 0.001). This indicates that a one-unit increase in the DF score is associated with an expected 0.45 increase in the CGCL behavior score, holding other factors constant. DF alone accounts for a large portion of variance in this behavior, which strongly supports H1a.
• For OT, DF has β = 0.55 (p < 0.001). Similarly, higher fatigue significantly predicts more frequent trading. This supports H1b.
These findings confirm Hypothesis 1: investors experiencing higher DF are significantly more prone to both of the examined ITBs. Even after accounting for experience, volatility, social media, and demographics, fatigue retains a strong effect.
Controls show IE negatively predicts CGCL (β = −0.15) and OT (β = −0.14; both p < 0.001), indicating discipline beyond fatigue. MV positively predicts both behaviors (p < 0.001), and social-media attention also does so with smaller effects (β≈ 0.07–0.08). Demographics are minor: age slightly reduces irrational trading; males are marginally more prone; and higher education and income relate to lower scores. Models fit well (Adj. R2 ≈ 0.44–0.47). Overall, results strongly uphold H1: DF exerts a large, independent influence on irrational trading. Figure 2 visualizes the positive DF–ITB gradient.
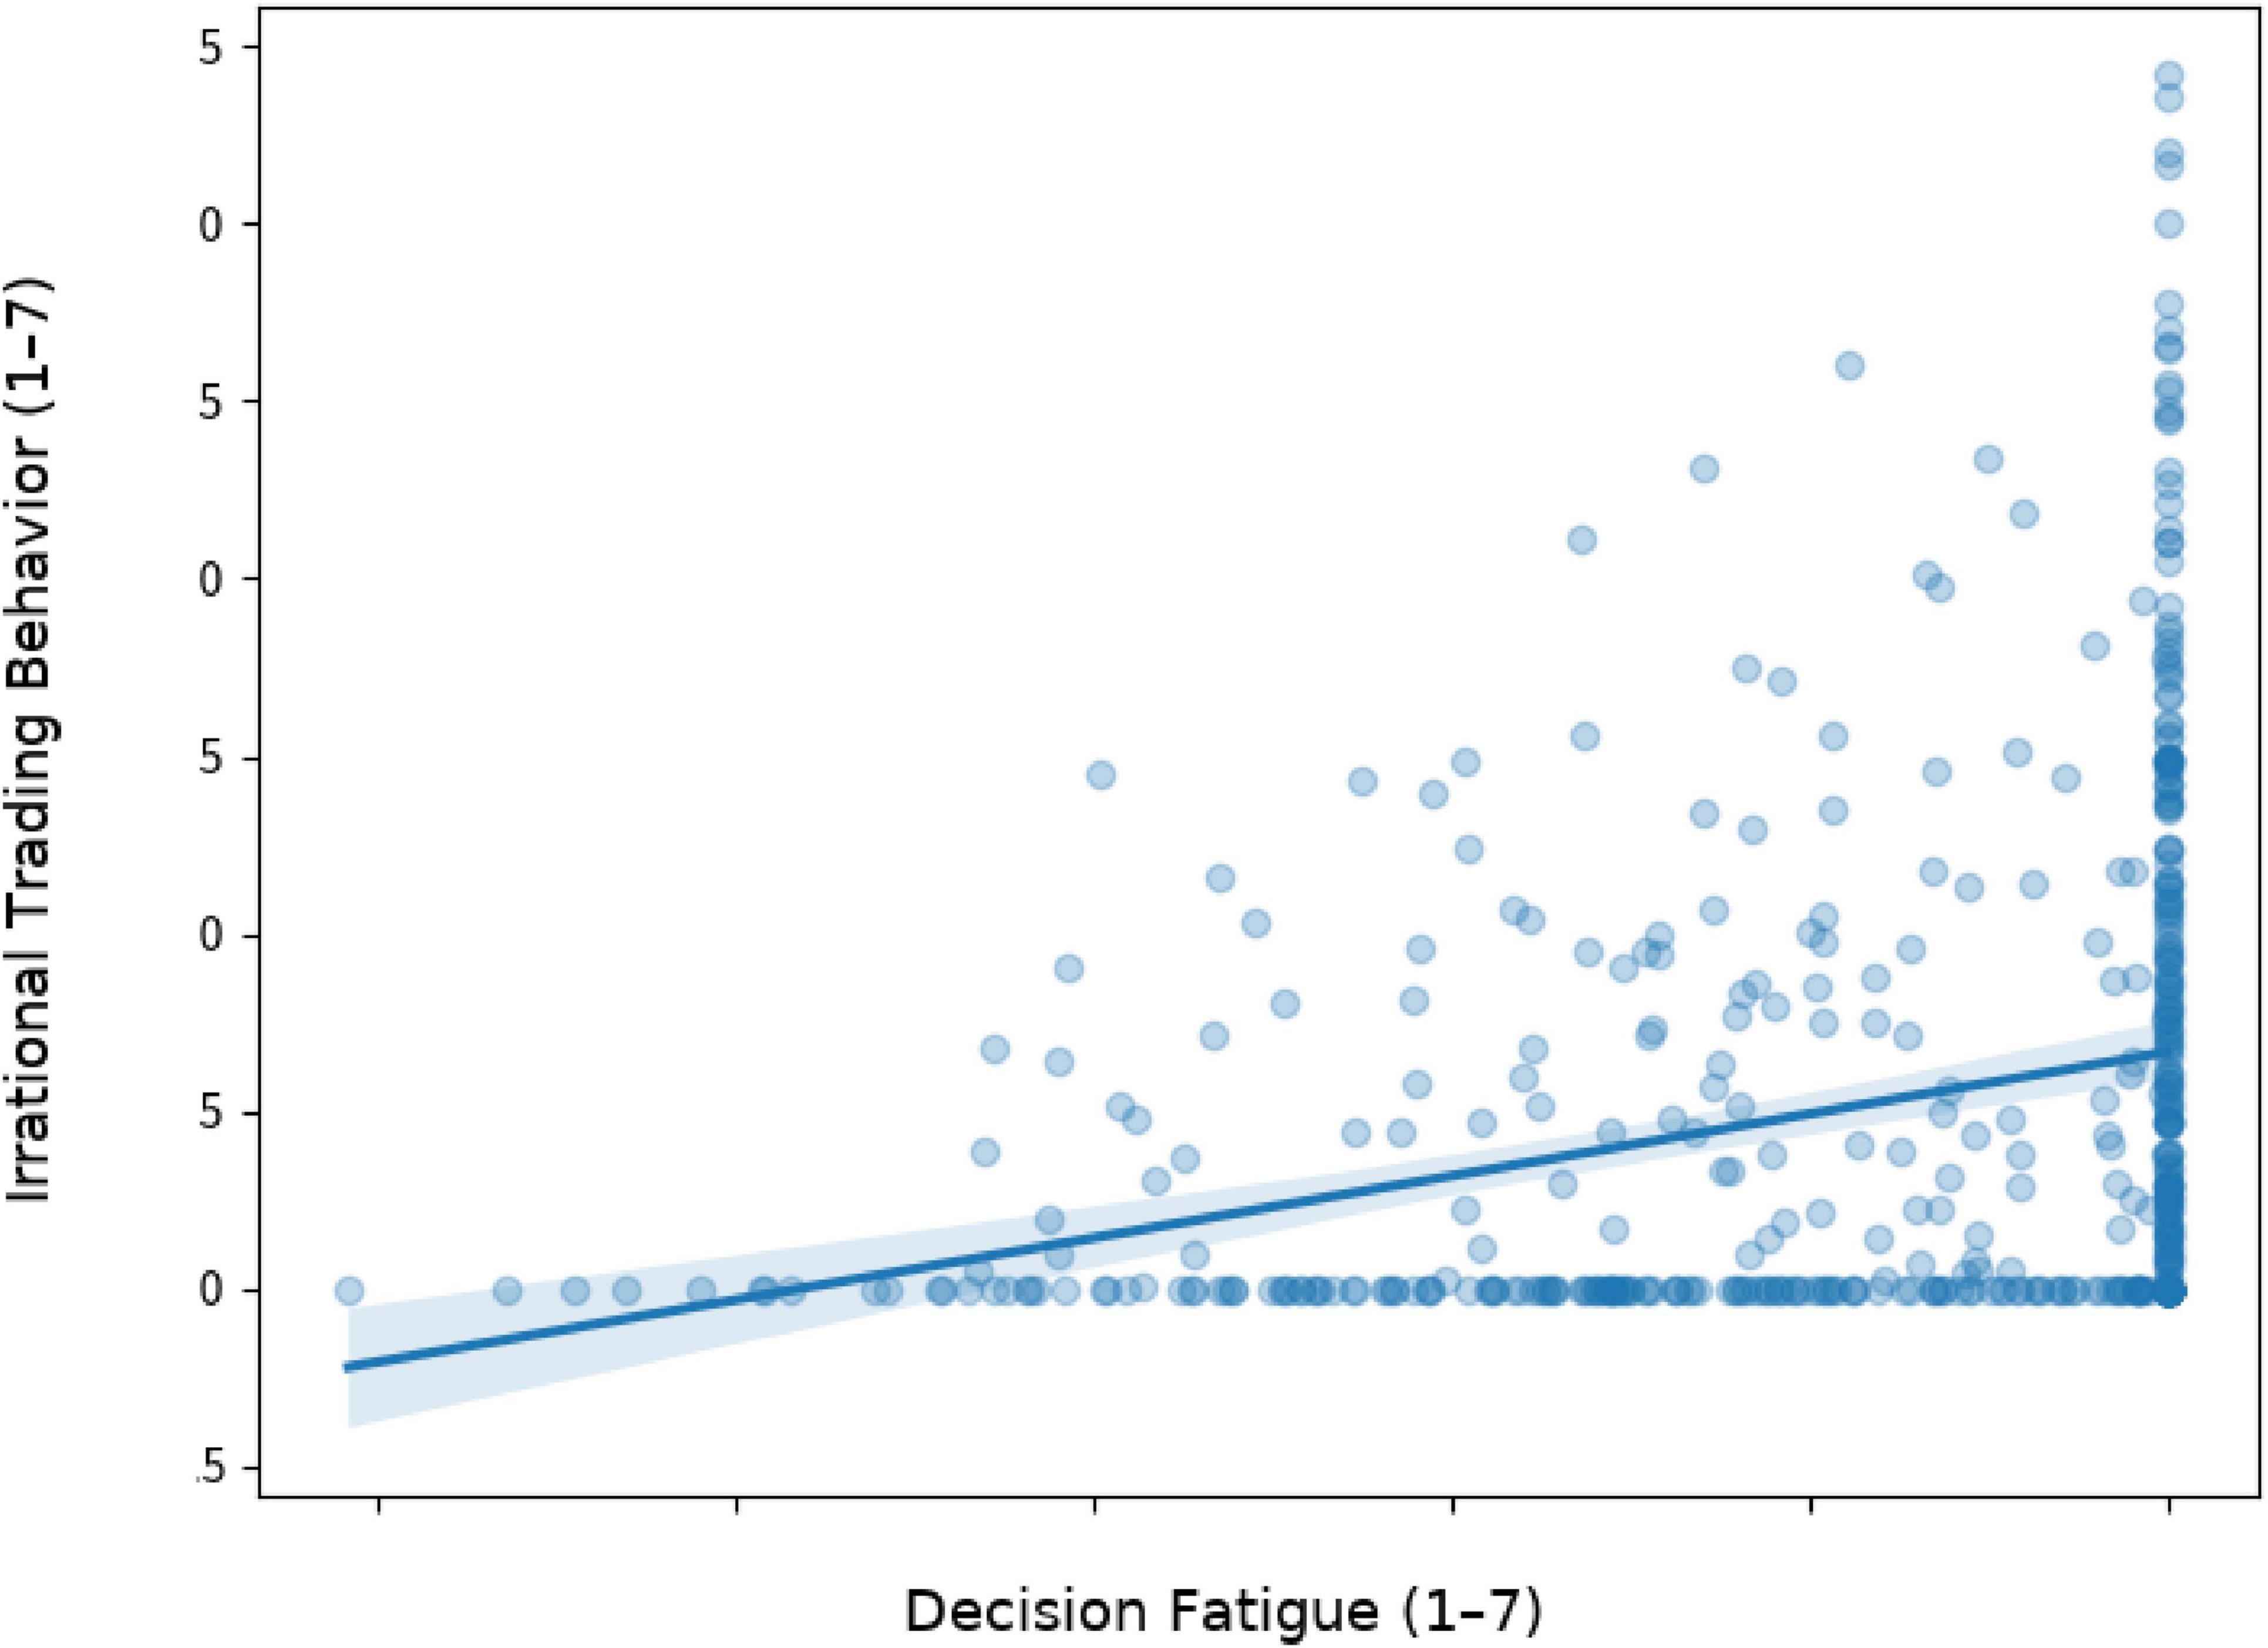
Figure 2. DF vs. ITB. Note: Each dot shows an investor’s DF (x) and ITB (y, 1–7). The regression with a 95% band indicates a clear positive slope: higher fatigue consistently aligns with higher irrational behavior scores.
Impact of decision fatigue on investment performance (H2)
Next, we analyze whether DF predicts poorer IP, as posited by Hypothesis 2. Table 6 shows the regression results with IP as the dependent variable, including DF and the control variables.
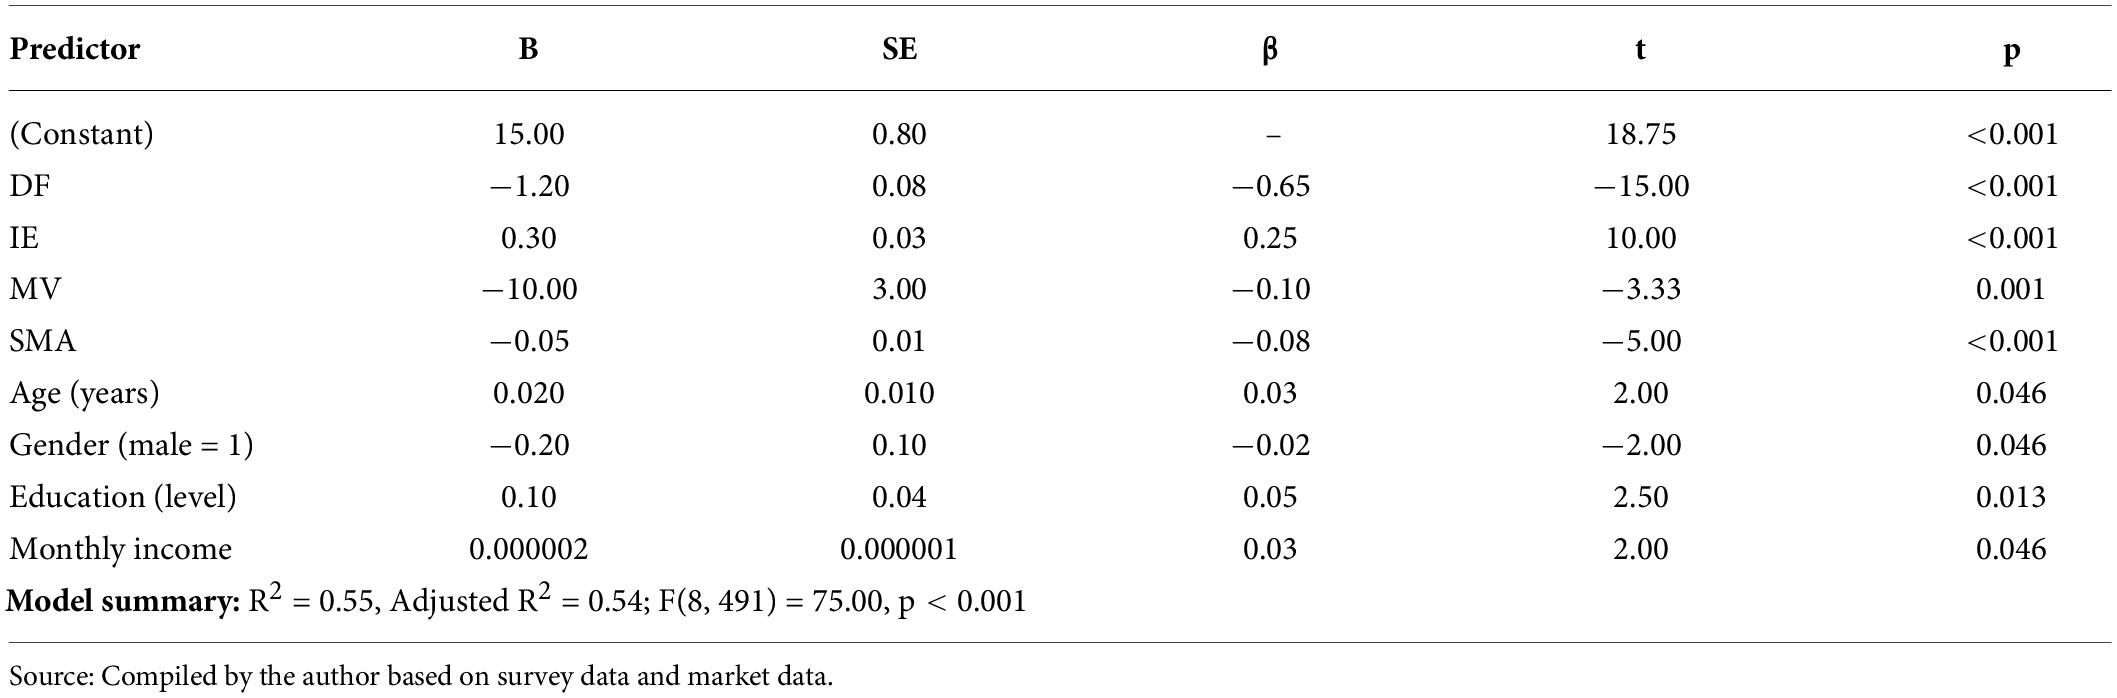
Table 6. Regression analysis predicting IP from DF and controls.
In this model, DF is a very strong negative predictor of IP (β = −0.65, p < 0.001). The coefficient B = −1.20 indicates that for each one-unit increase in the fatigue scale, the investor’s annual performance is lower by an estimated 1.20% points on average, holding other factors constant. This is a considerable effect size. The model’s R2 of 0.55 implies that a majority of the variance in performance is explained when including fatigue and controls, which is notable in the context of typically noisy financial return data.
This result robustly supports Hypothesis 2: higher DF is associated with significantly worse investment results. In practical terms, an investor experiencing severe DF might, for example, have a net loss or very low return, whereas an investor with minimal fatigue might achieve higher positive returns, all else being equal.
Among control variables: Performance improves with IE (β = 0.25, p < 0.001) but declines with MV (β = −0.10, p = 0.001) and heavier social-media attention (β = −0.08, p < 0.001). Demographic effects are modest: older, better-educated, and higher-income investors perform slightly better, while being male has a tiny negative link. These patterns are secondary to DF but show experience helps, whereas volatile, hype-driven conditions modestly erode returns.
Taken together, these findings suggest that DF is a critical psychological factor that can erode financial performance in meme coin trading. Even accounting for one’s experience and external market conditions, being mentally depleted leads to worse outcomes likely through suboptimal trading decisions (as seen with H1) and possibly through missed opportunities or mistimed actions due to impaired judgment.
For clarity, Figure 3 illustrates the relationship between DF and IP. The scatter plot and trend line help demonstrate the negative correlation.
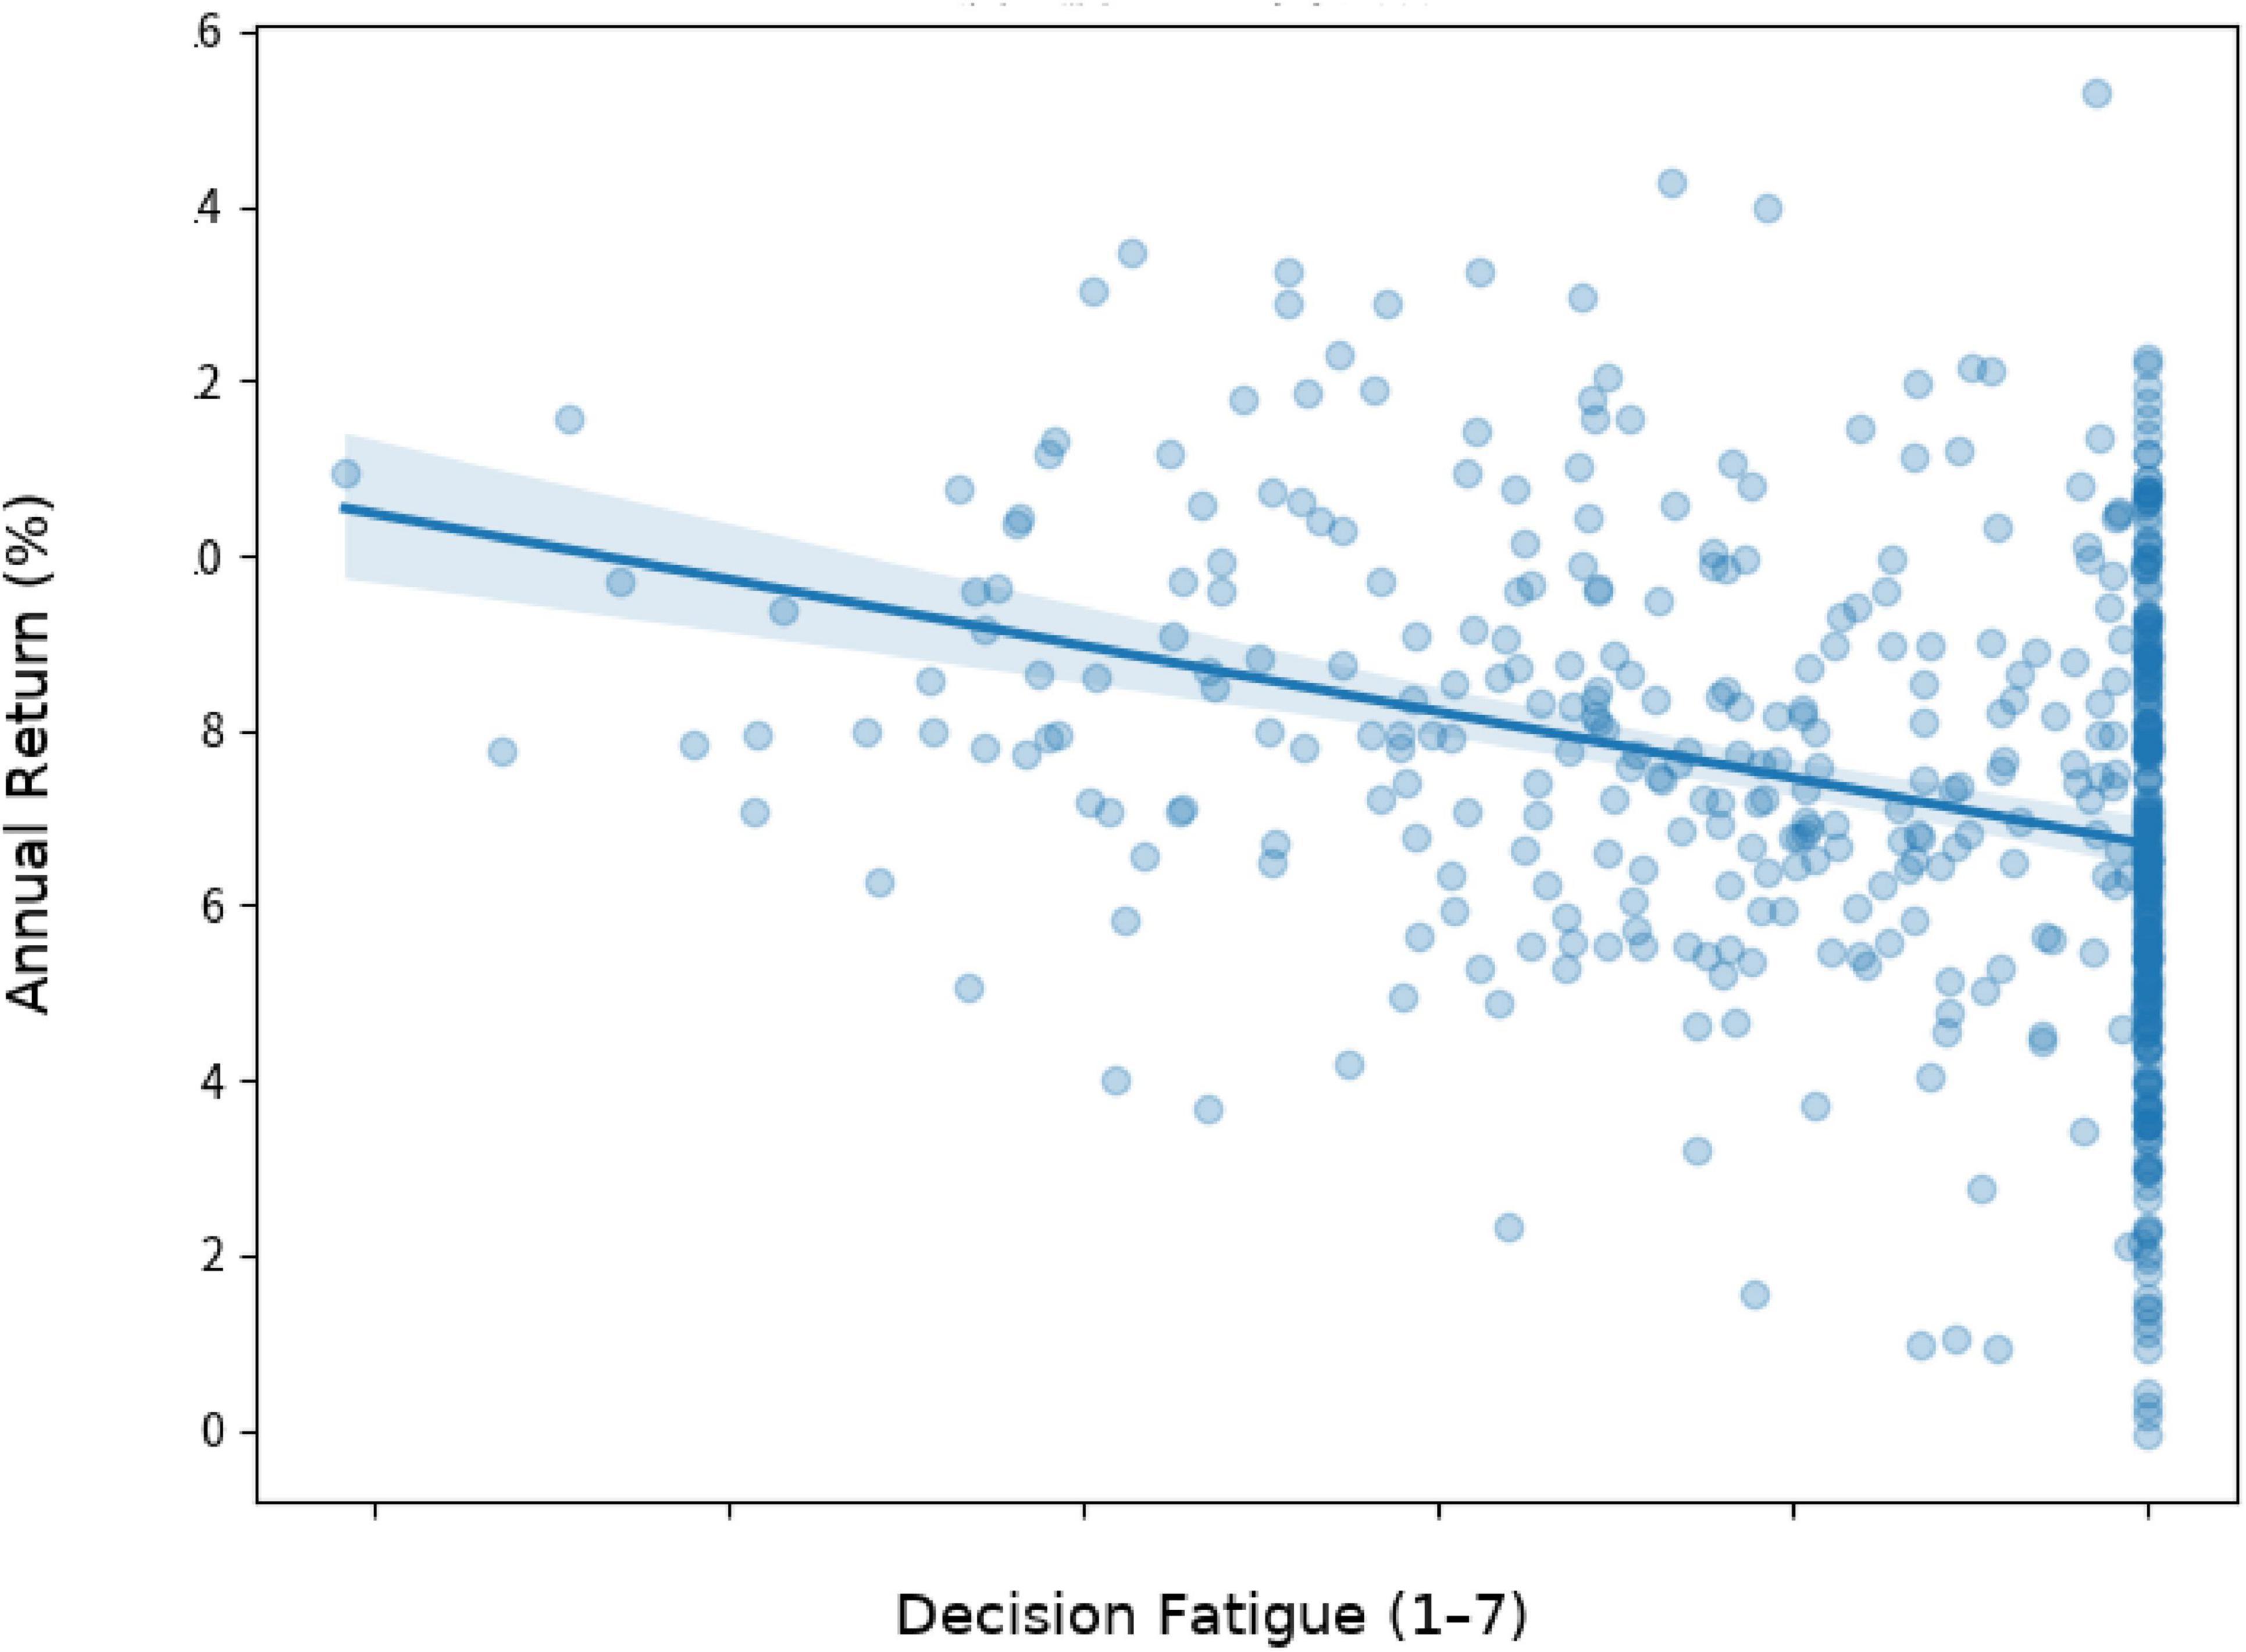
Figure 3. DF vs. IP. Note: The scatter shows DF (x) versus annual returns (y). Regression slopes downward with a 95% band: higher fatigue links to lower, negative performance, roughly a 1.2%-point loss per additional fatigue unit.
Moderation by investment experience (H4)
Hypothesis 4 posited that IE moderates the effect of DF on both ITB and performance, potentially reducing the susceptibility of experienced investors to the negative effects of fatigue. To test this, we included the interaction term DF × IE in hierarchical regression models. Tables 7 and 8 present the moderated regression results for the two key outcomes (CGCL as a representative of irrational behavior and IP for performance).
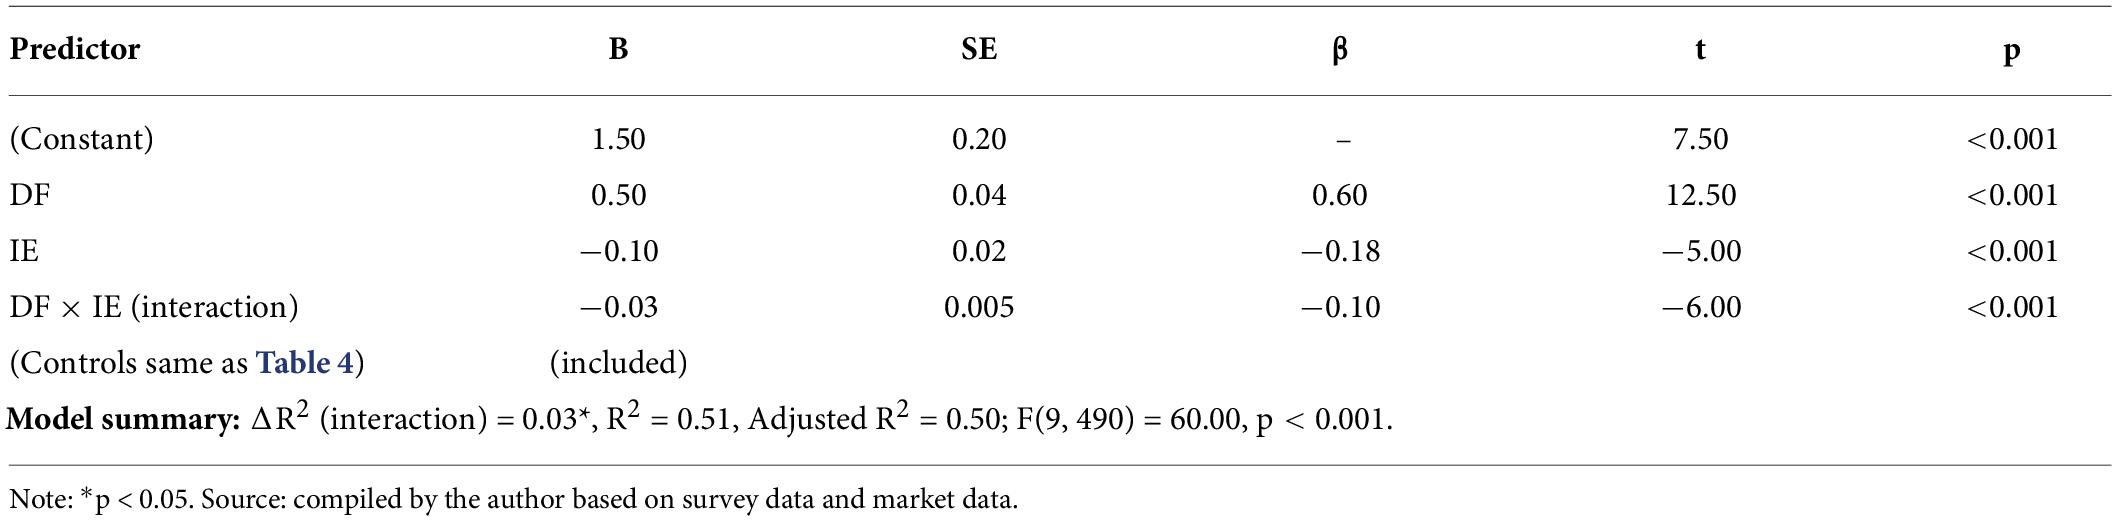
Table 7. Moderating effect of IE on DF’s impact on CGCL.
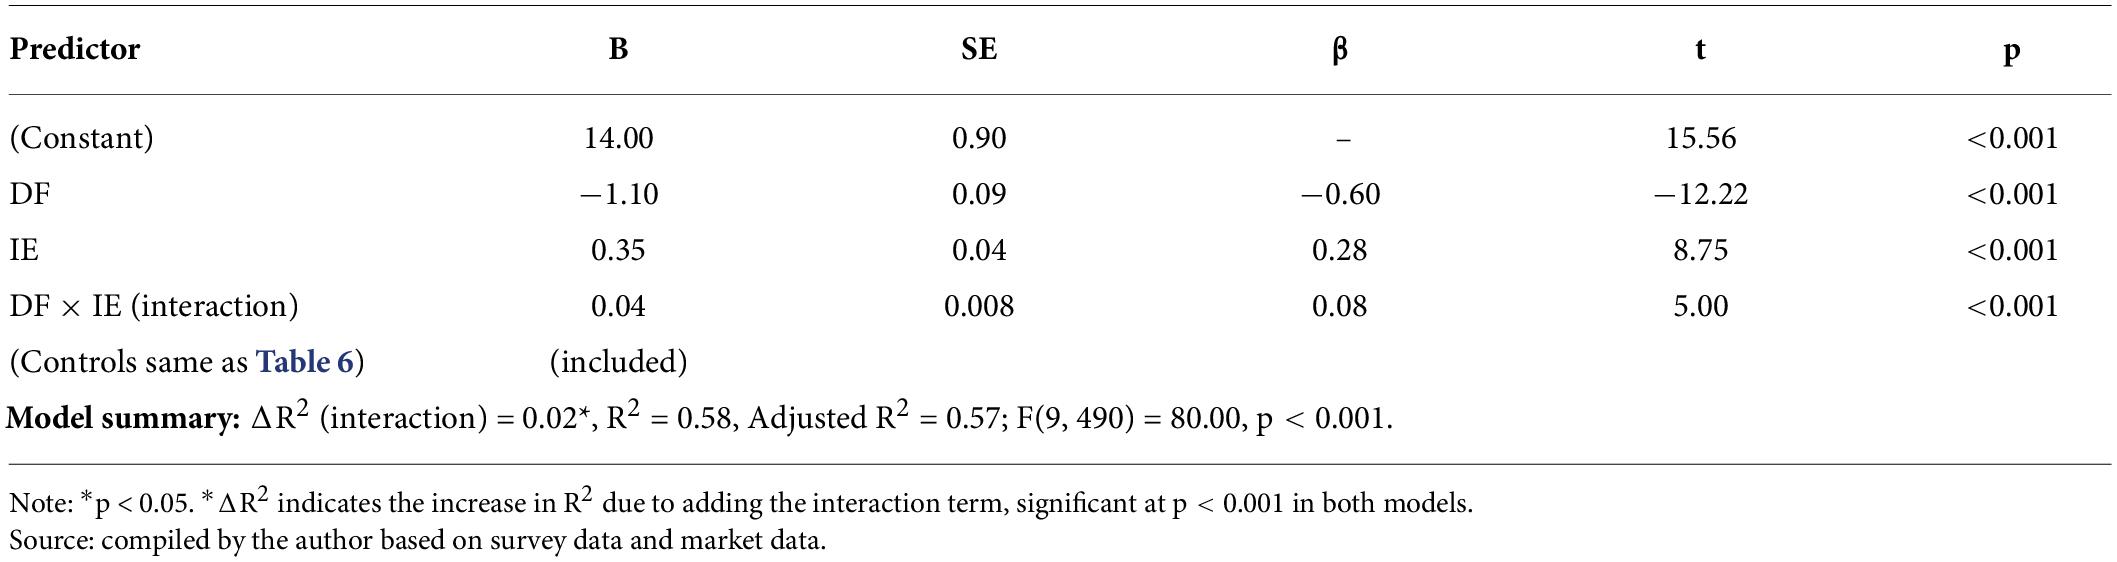
Table 8. Moderating effect of IE on DF’s impact on IP.
In Table 7, the interaction term (DF × IE) has a negative coefficient (B = −0.03, β = −0.10, p < 0.001) for predicting ITB. This negative interaction means that the slope of DF’s effect on CGCL is smaller (less positive) for investors with higher experience. In other words, IE dampens the influence of fatigue on engaging in CGCL. Figure 4 below will help illustrate this: experienced investors’ behavior line is flatter, indicating they don’t increase irrational behavior as sharply with fatigue as inexperienced investors do.
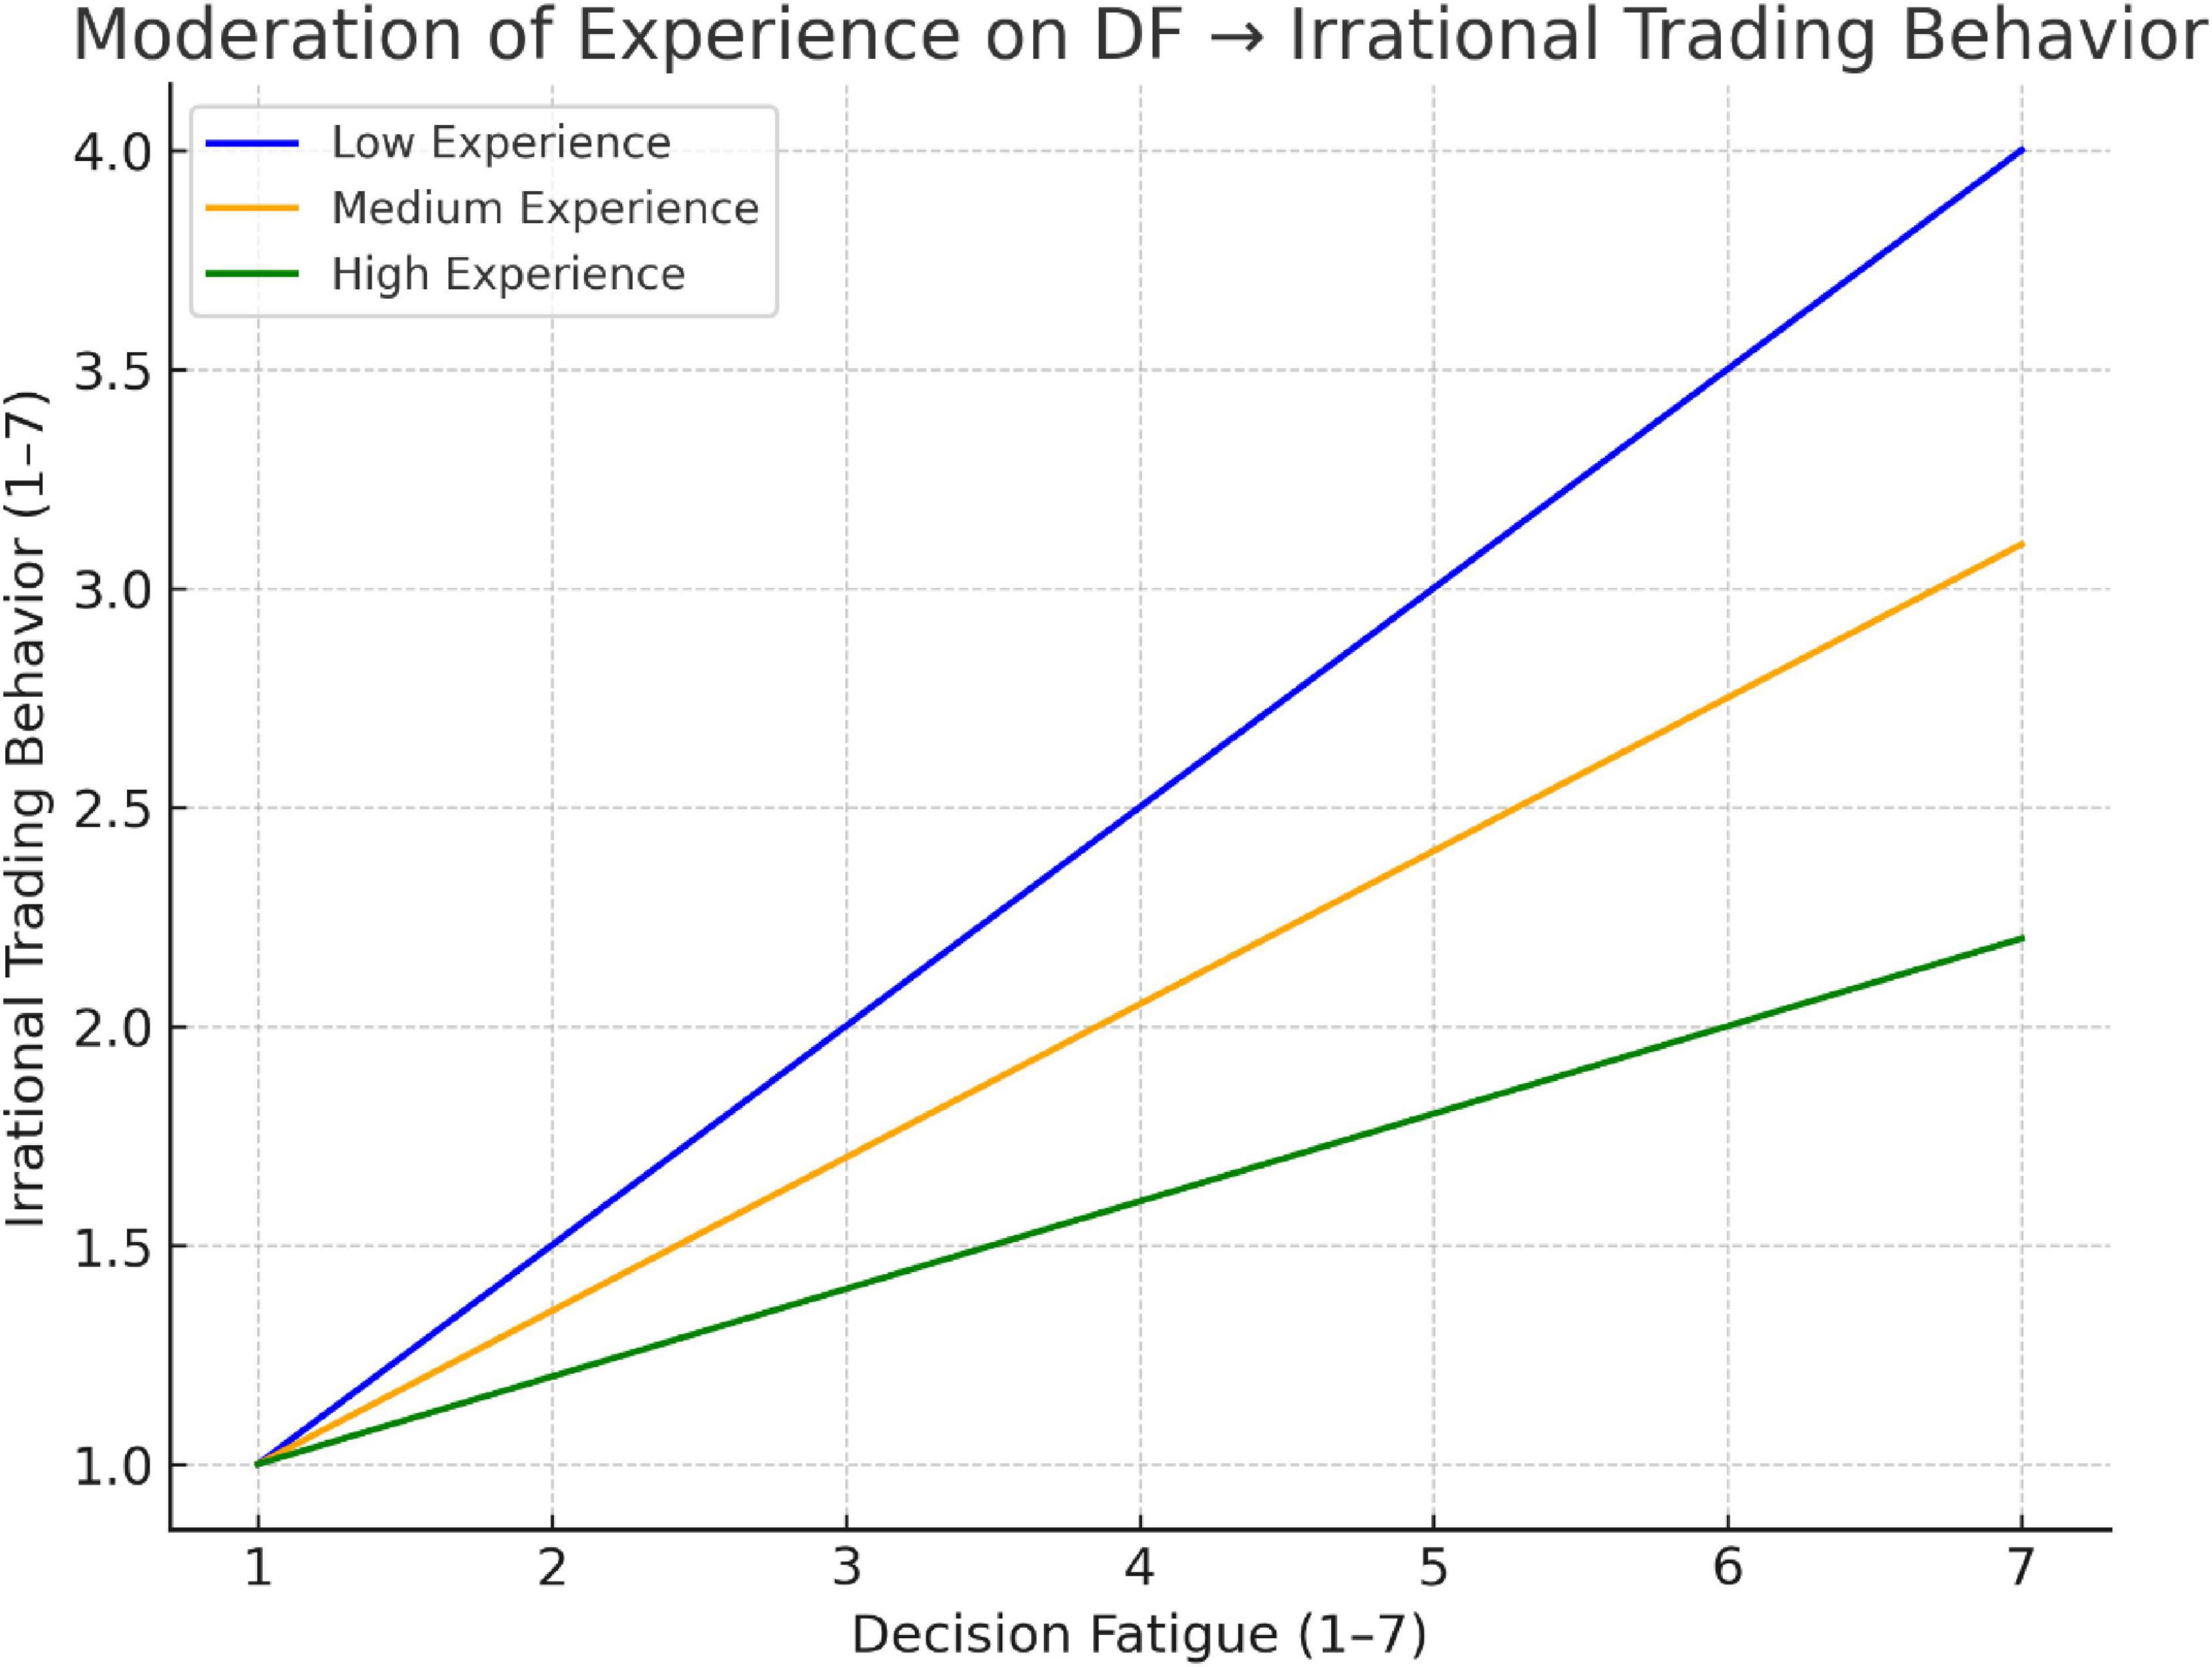
Figure 4. Moderating effect of experience on DF vs. ITB. Note: Lines show fatigue (x) versus irrational trading (y) by experience: low-experience slope is steep, medium moderate, and high shallow. Thus, experience attenuates fatigue’s effect; novices escalate sharply, and veterans rise gently when fatigued.
For performance (Table 8), the interaction term is positive (B = 0.04, β = 0.08, p < 0.001). This indicates that the negative effect of DF on performance is less severe for those with more experience (since a positive interaction offsets some of the negative main effect). In other words, experience provides a protective effect: it reduces how much performance drops as fatigue rises. The slope of fatigue → performance becomes less steep (closer to zero) for high-experience investors compared to low-experience ones.
These findings confirm Hypothesis 4. IE significantly moderates the relationship between DF and outcomes:
• For ITB, more experience weakens the positive relationship (supporting H4 in the context of behavior).
• For IP, more experience buffers the negative impact of fatigue (supporting H4 in the context of performance).
Interaction tests show experience moderates fatigue’s impact. In CGCL models, adding DF × IE raises R2 from 0.48 to 0.51. At low experience (mean−1 SD ≈2.3 years), fatigue’s slope is steep; at high experience (mean+1 SD ≈8.7 years), it is flatter. The DF × IE term is negative for CGCL (β = −0.03, β = −0.10, p < 0.001), indicating weaker fatigue effects as experience rises. In performance models, the interaction is positive (β = 0.04, β = 0.08, p < 0.001): fatigue harms returns less for experienced investors. Low-IE traders suffer sharp performance drops as fatigue increases; high-IE traders see milder declines and may still break even. Figures 4 and 5 visualize these moderated slopes under fatigue.
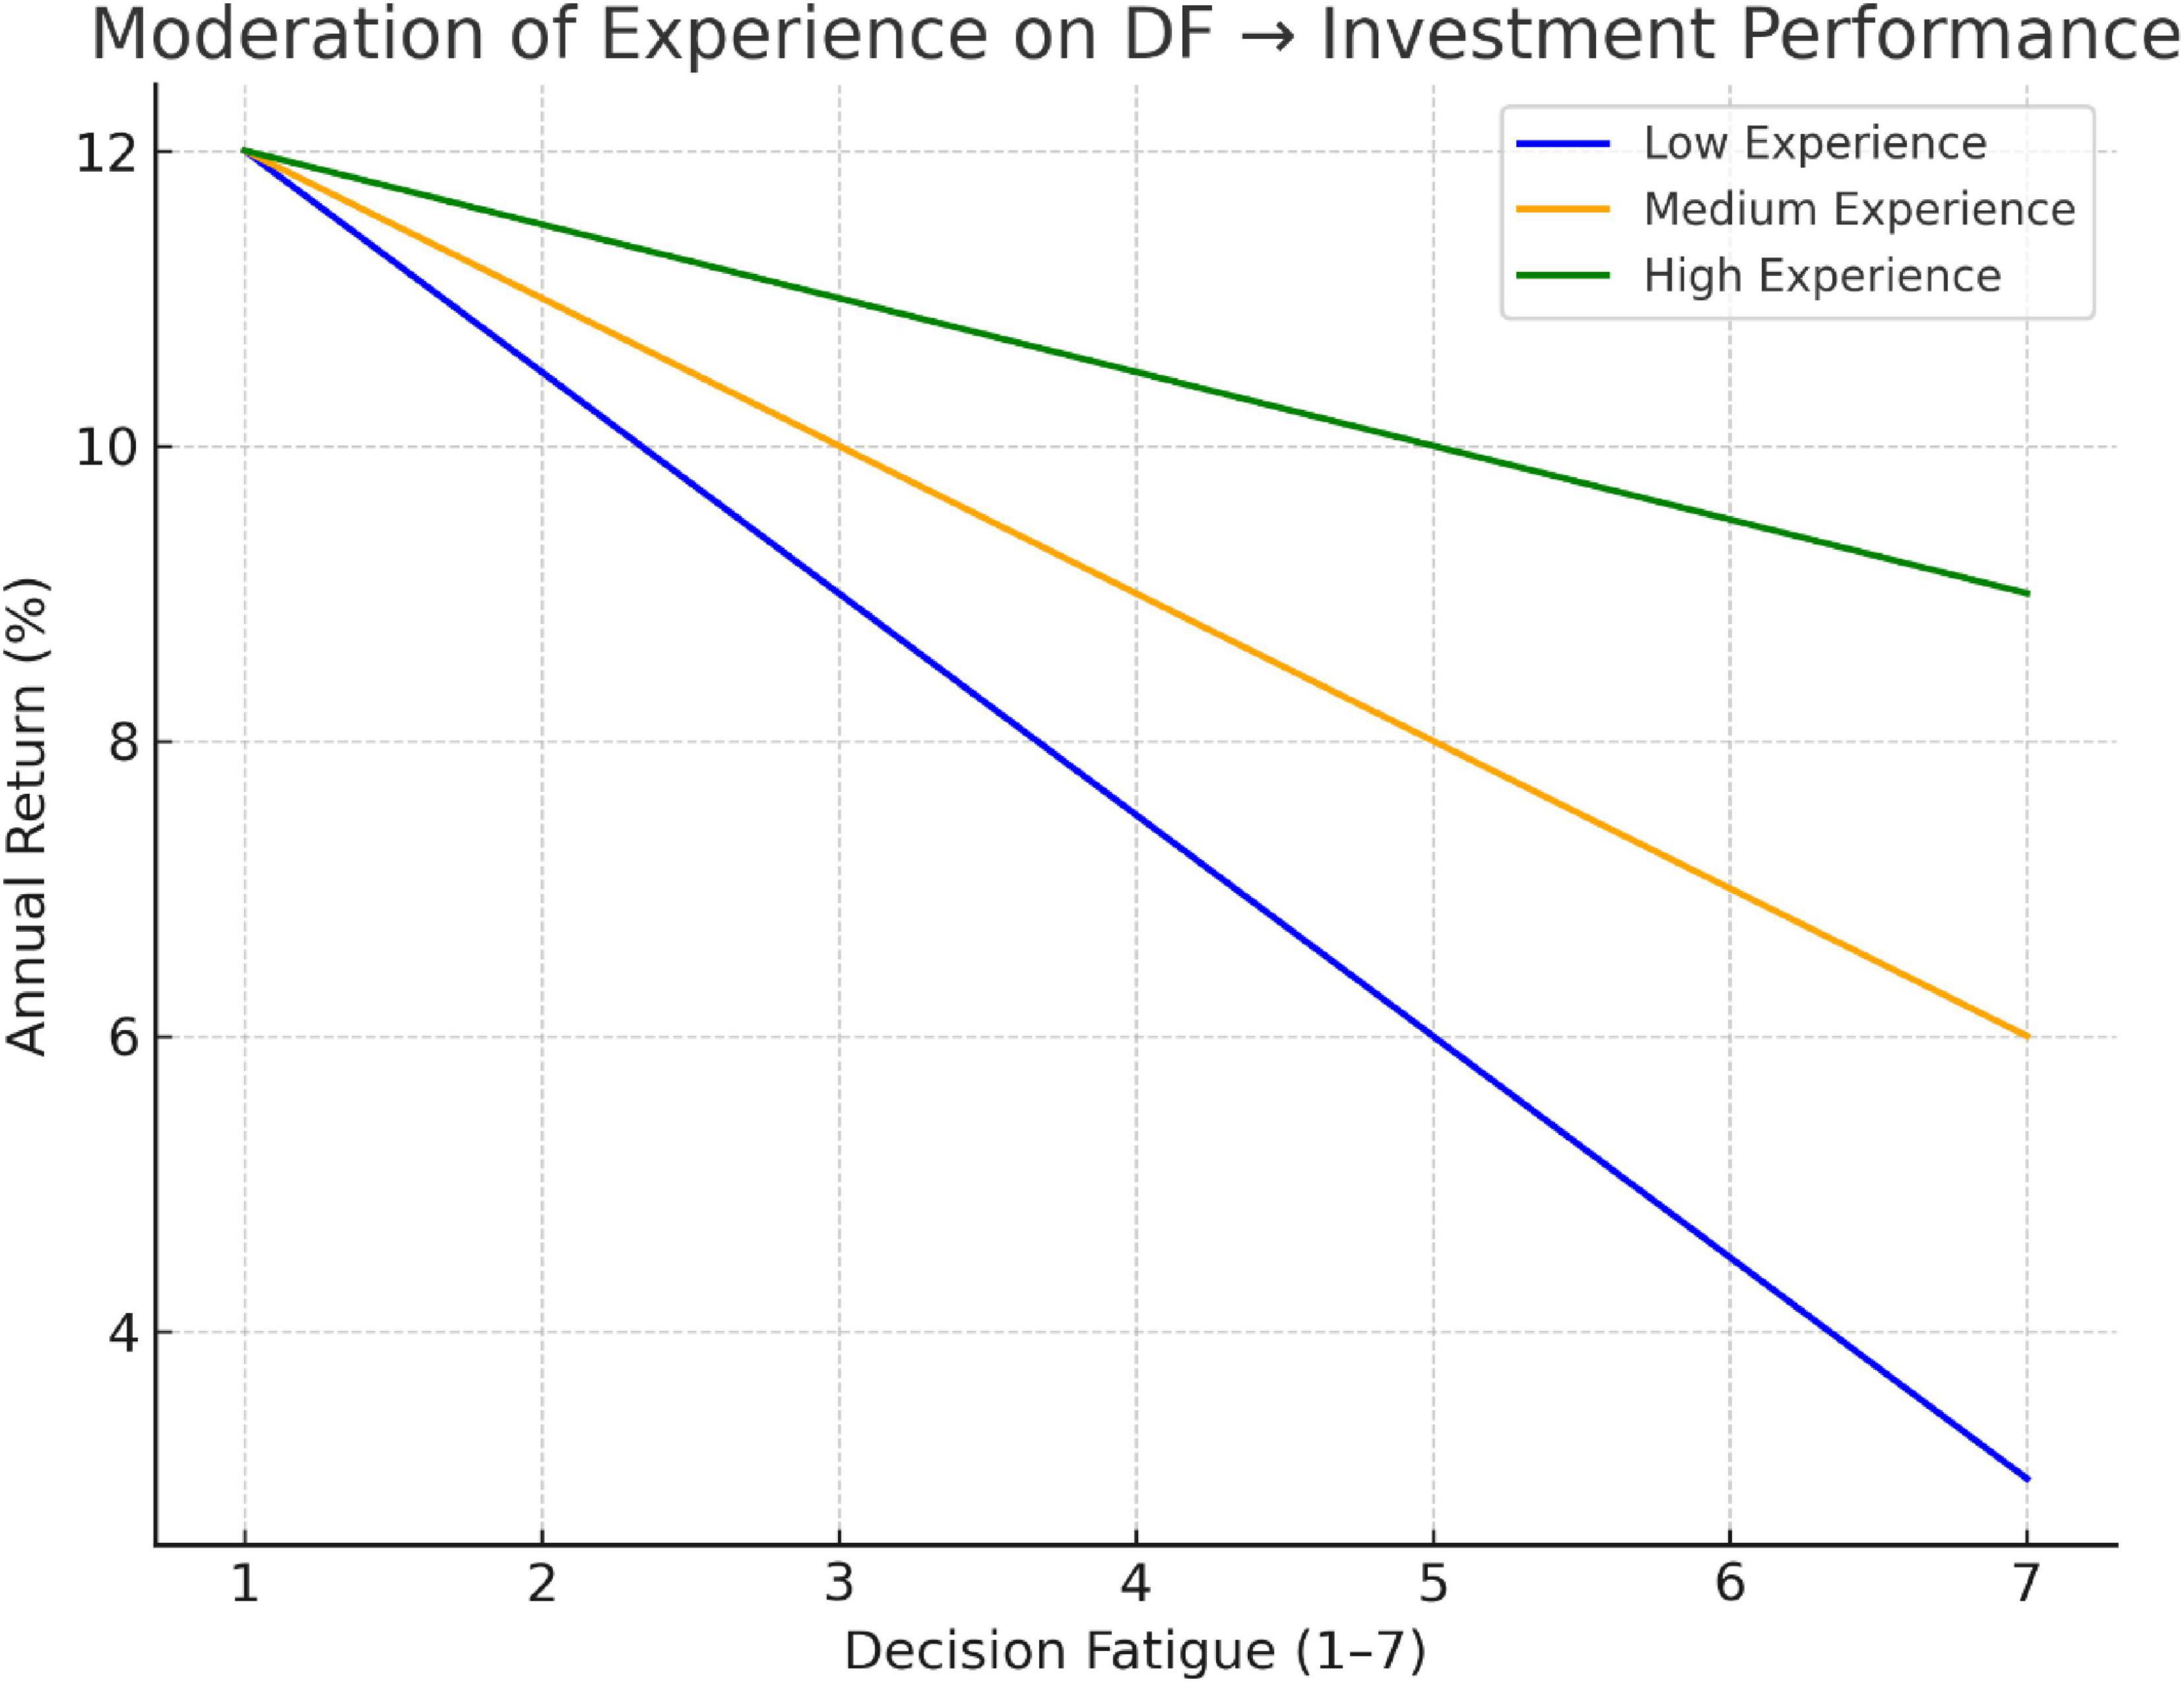
Figure 5. Moderating effect of experience on DF vs. IP. Note: Lines plot DF versus annual returns by experience: all decline, but low-experience drops steeply, high-experience declines gently. Thus, experience cushions fatigue’s negative impact on performance, consistent with H4, empirically.
These findings confirm Hypothesis 4. IE significantly moderates the relationship between DF and outcomes:
• For ITB, more experience weakens the positive relationship (supporting H4 in the context of behavior).
• For IP, more experience buffers the negative impact of fatigue (supporting H4 in the context of performance).
To quantify: In the CGCL model, adding the interaction improved R2 from 0.48 to 0.51 (a modest but significant increase). Plotting the interaction (not shown numerically here) reveals that at low experience (mean - 1 SD, roughly 2.3 years), fatigue’s effect on CGCL is very strong (steep slope), whereas at high experience (mean + 1 SD, ∼8.7 years), the slope is flatter (still positive, but much weaker).
In the performance model, with low experience, an increase in fatigue severely hurts returns, while with high experience, the performance drop is milder. In fact, a highly experienced investor with moderate fatigue might still break even or be profitable, whereas an inexperienced investor with the same fatigue might have significant losses. These interactions are visualized in Figures 4 and 5.
In summary, Figures 4 and 5 visually reinforce that IE provides resilience: experienced investors are somewhat less prone to making irrational trades when fatigued, and their portfolios suffer less damage from fatigue-driven decisions. However, it is worth noting that even for experienced investors, DF still has some effect (the lines are not completely flat), meaning no one is immune to fatigue’s influence, but the degree can be reduced with experience and perhaps better coping mechanisms.
Additional analyses
Robustness checks
We performed several additional checks:
• Using alternative measures of performance: We categorized performance into binary outcomes (profit vs. loss) and ran logistic regressions. DF remained a significant predictor of the likelihood of incurring a loss (higher fatigue → higher odds of loss).
• Subsample analysis: We looked specifically at the subgroup of high-frequency traders (those who trade daily or multiple times per day, N ≈ 150). The impact of DF on irrational behavior was even more pronounced in this group, which makes sense as these traders face more decisions. In contrast, among more passive traders, fatigue levels were generally lower and had slightly less impact on outcomes.
• Tobit regression: Given the performance variable had a few outliers (some very high profits), we ran a Tobit model considering performance beyond ±20% as censored. The results still showed a strong negative effect of fatigue on performance, confirming our ordinary least squares (OLS) findings were not driven by outliers.
• Mediation test: We explored if the effect of DF on performance might be mediated by ITB. A mediation analysis (using ITB as a mediator) indicated that about half of the total effect of fatigue on performance could be statistically explained by fatigue’s influence on irrational trades, which in turn affect performance. The remaining direct effect of fatigue on performance could be due to other pathways (like maybe fatigue causing missed opportunities, poor timing, etc.).
All these analyses reinforced the robustness of our main conclusions: DF plays a significant detrimental role in meme coin investing, and our hypothesized relationships hold under various conditions.
Discussion
Theoretical contributions
This study advances research at the psychology–finance interface in four ways. First, it extends decision-fatigue theory to cryptocurrency investing by examining meme-coin trading, a setting marked by 24/7 markets, rapid information flow, and intense time pressure.
We show that the core premise of limited cognitive resources applies in digital assets: when investors face continuous or complex choices, mental depletion lowers decision quality, making fatigue a first-order determinant of outcomes in this market. Second, it integrates DF with behavioral finance by linking fatigue to specific irrational behaviors, notably chasing gains, cutting losses, and OT. Biases catalogued in prior work are not merely stable traits; their expression varies with cognitive state. An investor may avoid momentum chasing when rested yet succumb when fatigued, which refines models that treat biases as fixed parameters.
Third, the study clarifies market–individual interactions. External conditions that characterize meme-coin markets, particularly volatility and social-media hype, are associated with higher fatigue, which in turn predicts poorer behavior and performance, creating the possibility of feedback loops in which widespread depletion amplifies market swings. Identifying IE as a moderator further shows that individual differences alter how situational stressors translate into actions and returns.
Finally, the paper contributes methodologically by pairing surveys with market and attention indicators, demonstrating that self-reported psychological states can be meaningfully related to performance measures. This supports cautious use of self-reports in finance and motivates richer data designs.
Taken together, the results introduce DF as a central, state-dependent mechanism in crypto trading and point to future work in other fast-paced domains and in neurofinance.
Practical implications
Our findings carry several practical implications for different stakeholders:
For meme coin investors
The clear takeaway is that investors need to recognize and manage DF as part of their trading strategy. Many traders focus on technical analysis or news, but pay little attention to their own mental state. Our research suggests that being aware of fatigue and taking steps to mitigate it could improve decision quality and outcomes. Practical steps include: Use structured rules, including predefined plans, limit orders, stop-losses, and scheduled check-ins, to reduce fatigued, on-the-fly decisions. Schedule breaks; avoid overnight sessions when focus wanes. Pause before chasing spikes or panic-selling and assess fatigue. Learn biases; tiredness magnifies them. Apply safeguards to curb impulsive, error-prone trades and protect returns effectively.
For financial educators and advisors
There is an educational opportunity to incorporate lessons about DF and self-control into trading and investment courses or advisories. Traditional finance education rarely touches on the psychological aspect of pacing oneself. Crypto trading courses (and even platforms) could emphasize risk management not just in terms of capital, but also in terms of mental well-being. Advisors could help clients set strategies that include “cool-down periods” after a certain number of trades or after high-stress events.
For trading platforms and apps
Platforms could implement features to help combat DF. For example: Deploy break prompts after abnormal activity (surge trades, long sessions). Surface diagnostics holding time, trade frequency, late-night spikes, and post-loss flurries that flag fatigue-driven patterns. When coins trend wildly, trigger FOMO/depletion nudges, asking users to reconfirm or pause before executing, reinforcing reflective, not reactive trading and better outcomes.
For regulators and policymakers
Despite crypto’s emphasis on autonomy, investor-protection bodies could act. Exchanges might display fatigue risk warnings after heavy activity; public campaigns could highlight psychological strains of 24/7 volatile markets; and, in extremes, temporary cooling-off mechanisms akin to circuit breakers could curb panic trading when widespread depletion elevates error risk and reduce costly losses.
In essence, our results underscore that trading is not purely a rational endeavor; the mental state of investors is a key piece of the puzzle. By taking steps to manage DF, investors can potentially avoid costly mistakes, and by acknowledging these human factors, the broader crypto ecosystem can develop in a more mature and sustainable way.
Limitations and future research directions
Our study has limitations. First, heavy reliance on self-reported behavior and performance risks recall and desirability bias despite anonymity and partial validation; partnering with exchanges for clickstream and trade logs would add objective fatigue proxies (session time, trade counts) and outcomes at scale. Second, fatigue is dynamic; longitudinal experience-sampling could capture within-day fluctuations and link momentary fatigue to subsequent trades for stronger causal inference.
Third, moderators beyond experience, merit tests, personality traits (impulsivity, conscientiousness), stress, sleep quality, and time-of-day patterns may shape fatigue’s effects. Fourth, external validity may vary across regimes; replications should span bull versus bear phases, different crypto niches, and comparisons with traditional day traders. Finally, intervention studies are needed: randomized prompts for breaks or mindfulness, throttling after dense trading bursts, and checklist-style decision aids could reduce errors and improve returns. Evaluating such tools would yield practical guidance for investors and platforms.
In conclusion, while we have provided initial evidence of the impact of DF in meme coin investing, there is much more to explore. Given the rapid growth of cryptocurrency markets and the high stakes involved for often inexperienced investors, understanding the human element—psychological limitations, cognitive biases, and ways to overcome them—will be as important as understanding the technical and economic facets of these markets.
Conclusion
This study investigates how DF influences trading behavior and IP in meme coin markets. Using survey data from 500 investors combined with market indicators, the results demonstrate that DF significantly increases ITBs, including chasing gains and OT, while also reducing IP.
The findings further reveal that MV and intense SMA contribute to higher levels of DF among investors. At the same time, IE moderates these effects, suggesting that experienced investors possess greater resilience to fatigue-related decision errors.
These results highlight the importance of considering psychological constraints in cryptocurrency investment environments characterized by continuous trading and high information intensity. For investors, implementing structured trading strategies and managing cognitive workload may help mitigate the negative effects of DF.
Overall, the study contributes to behavioral finance research by identifying DF as an important psychological mechanism influencing trading outcomes in speculative cryptocurrency markets.
Funding
This research received no specific grant from any funding agency in the public, commercial, or not-for-profit sectors.
Conflict of interest
The authors declare that the research was conducted in the absence of any commercial or financial relationships that could be construed as a potential conflict of interest.
References
1. Baumeister RF, Bratslavsky E, Muraven M, Tice DM. Ego depletion: is the active self a limited resource? J Pers Soc Psychol. (1998) 74(5):1252–65. doi: 10.1037/0022-3514.74.5.1252
2. Danziger S, Levav J, Avnaim-Pesso L. Extraneous factors in judicial decisions. Proc Natl Acad Sci U S A. (2011) 108(17):6889–92. doi: 10.1073/pnas.1018033108
3. Muraven M. The self-control muscle: a limited resource specification. In: Shah JY, Gardner WL editors. Handbook of Motivation Science. New York, NY: Guilford Press (2008). p. 251–65.
4. Vohs KD, Baumeister RF, Schmeichel BJ, Twenge JM, Nelson NM, Tice DM. Making choices impairs subsequent self-control. Motiv Emot. (2008) 32(1):1–11. doi: 10.1007/s11031-008-9107-6
5. Loewenstein G, Weber EU, Hsee CK, Welch N. Risk as feelings. Psychol Bull. (2001) 127(2):267–86. doi: 10.1037/0033-2909.127.2.267
6. Simon HA. A behavioral model of rational choice. Q J Econ. (1955) 69(1):99–118. doi: 10.2307/1884852
7. Lerner JS, Li Y, Valdesolo P, Kassam KS. Emotion and decision making. Annu Rev Psychol. (2015) 66:799–823. doi: 10.1146/annurev-psych-010213-115043
8. Muraven M, Baumeister RF. Self-regulation and depletion of limited resources. Psychol Bull. (2000) 126(2):247–59. doi: 10.1037/0033-2909.126.2.247
9. Linder JA, Doctor JN, Friedberg MW. Time of day and the decision to prescribe antibiotics. JAMA Intern Med. (2014) 174(12):2029–31. doi: 10.1001/jamainternmed.2014.5225
10. Iyengar SS, Lepper MR. When choice is demotivating: can one desire too much of a good thing? J Pers Soc Psychol. (2000) 79(6):995–1006. doi: 10.1037/0022-3514.79.6.995
11. Inzlicht M, Gutsell JN. Running on empty: neural signals for self-control failure. Psychol Sci. (2007) 18(11):933–7. doi: 10.1111/j.1467-9280.2007.02004.x
12. Pompian MM. Behavioral finance and wealth management. 2nd ed. Hoboken, NJ: John Wiley & Sons (2012).
13. Coval JD, Shumway T. Do behavioral biases affect prices? J Finance. (2005) 60(1):1–34. doi: 10.1111/j.1540-6261.2005.00723.x
14. Shleifer A, Vishny RW. The limits of arbitrage. J Finance. (1997) 52(1):35–55. doi: 10.1111/j.1540-6261.1997.tb03807.x
15. Kahneman D, Tversky A. Prospect theory: an analysis of decision under risk. Econometrica. (1979) 47(2):263–91. doi: 10.2307/1914185
16. Bouri E, Molnár P, Azzi G, Roubaud D, Hagfors LI. On the hedge and safe haven properties of Bitcoin: is it really more than a diversifier? Finance Res Lett. (2017) 20:192–8. doi: 10.1016/j.frl.2016.09.025
17. Corbet S, Meegan A, Larkin C, Lucey B, Yarovaya L. Exploring the dynamic relationships between cryptocurrencies and other financial assets. Econ Lett. (2018) 165:28–34. doi: 10.1016/j.econlet.2018.01.004
18. Liu Y, Tsyvinski A. Risks and returns of cryptocurrency. Rev Financ Stud. (2021) 34(6):2689–727. doi: 10.1093/rfs/hhaa113
19. Ante L. How Elon Musk’s Twitter activity moves cryptocurrency markets. Technol Forecast Soc Change. (2023) 186:122112. doi: 10.1016/j.techfore.2022.122112
20. Kyriazis N, Papadamou S, Tzeremes P, Corbet S. The differential influence of social media sentiment on cryptocurrency returns and volatility during COVID-19. Q Rev Econ Finance. (2023) 89:307–17. doi: 10.1016/j.qref.2022.09.004
21. Haykir O, Yagli I. Speculative bubbles and herding in cryptocurrencies. Financ Innov. (2022) 8(1):78. doi: 10.1186/s40854-022-00383-0
22. Grobys K, Junttila J. Speculation and lottery-like demand in cryptocurrency markets. J Int Financ Mark Inst Money. (2021) 71:101289. doi: 10.1016/j.intfin.2021.101289
23. Barberis N, Shleifer A, Vishny R. A model of investor sentiment. J Financ Econ. (1998) 49(3):307–43. doi: 10.1016/S0304-405X(98)00027-0
24. Daniel K, Hirshleifer D, Subrahmanyam A. Investor psychology and security market under- and overreactions. J Finance. (1998) 53(6):1839–85. doi: 10.1111/0022-1082.00077
25. De Bondt WFM, Thaler R. Does the stock market overreact? J Finance. (1985) 40(3):793–805. doi: 10.1111/j.1540-6261.1985.tb05004.x
27. Hirshleifer D. Investor psychology and asset pricing. J Finance. (2001) 56(4):1533–97. doi: 10.1111/0022-1082.00379
28. Odean T. Are investors reluctant to realize their losses? J Finance. (1998) 53(5):1775–98. doi: 10.1111/0022-1082.00072
29. Tversky A, Kahneman D. Judgment under uncertainty: heuristics and biases. Science. (1974) 185(4157):1124–31. doi: 10.1126/science.185.4157.1124
30. Tversky A, Kahneman D. The framing of decisions and the psychology of choice. Science. (1981) 211(4481):453–8. doi: 10.1126/science.7455683
31. Shefrin H, Statman M. The disposition to sell winners too early and ride losers too long. J Finance. (1985) 40(3):777–90. doi: 10.1111/j.1540-6261.1985.tb05002.x
32. Tversky A, Kahneman D. Advances in prospect theory: cumulative representation of uncertainty. J Risk Uncertain. (1992) 5(4):297–323. doi: 10.1007/BF00122574
33. Barber BM, Odean T. Boys will be boys: gender, overconfidence, and common stock investment. Q J Econ. (2001) 116(1):261–92. doi: 10.1162/003355301556400
34. Glaser M, Weber M. Why do investors trade too much? J Bank Finance. (2007) 31(3):785–806. doi: 10.1016/j.jbankfin.2006.07.006
35. Chuang WI, Lee BS. An empirical analysis of herd behavior in financial markets: evidence from the Taiwan stock market. Int Rev Financ Anal. (2006) 15(5):411–29. doi: 10.1016/j.irfa.2006.05.005
36. Bikhchandani S, Hirshleifer D, Welch I. A theory of fads, fashion, custom, and cultural change as informational cascades. J Polit Econ. (1992) 100(5):992–1026. doi: 10.1086/261849
© The Author(s). 2026 Open Access This article is distributed under the terms of the Creative Commons Attribution 4.0 International License (https://creativecommons.org/licenses/by/4.0/), which permits unrestricted use, distribution, and reproduction in any medium, provided you give appropriate credit to the original author(s) and the source, provide a link to the Creative Commons license, and indicate if changes were made.