Introduction
The human body is a dynamic open system that constantly exchanges matter, energy, and information with the environment, adapting to its changes. This is a general scientific biological paradigm. Medical professionals recognize that heart rate (HR) is a key indicator of the functional state of all bodily systems, reflecting the body’s universal response to external and internal influences. Consequently, heart rate variability (HRV) analysis is employed to evaluate both autonomic nervous system (ANS) function and the overall physiological condition of the body.
Assessing the cardiovascular system through HR measurement is regarded as the most accessible monitoring method, as it can be performed using the traditional palpatory technique or various electrocardiographic recording methods, including telemetry-based approaches. The list of basic diagnostic methods also includes the traditional determination of blood pressure (BP) parameters. However, sports medicine doctors know (1, 2) that in trained individuals, BP does not decrease, but, on the contrary, in some cases, increases during training. That is why, for an objective assessment of the cardiovascular system, hemodynamic indicators are also used today: stroke volume and cardiac output, vascular resistance and blood flow velocity, which can be achieved using the rheography (rheoplethysmography) method.
In recent years, HRV analysis has become increasingly popular. This approach focuses on examining sequential respiratory rate (RR) intervals, offering valuable insights into the regulation of the cardiovascular system by the parasympathetic and sympathetic branches of the ANS. Numerous domestic and international researchers (3, 4) suggest that analyzing cardiointervals provides a more sensitive assessment of subtle variations in ANS activity under various influences compared to traditional metrics like HR and BP.
Changes in HR and pulse wave simultaneously, rather than in stages, are not yet sufficiently studied, and the conclusions on this subject are contradictory (5, 6). This can be explained by the fact that there are peculiarities like hormonal and physiological changes in men and women (7, 8). Therefore, for an objective assessment of the work of the cardiovascular system, a characteristic in two dimensions is insufficient; there is a need for long-term studies (in particular, Holter monitoring of the HR).
Based on this, we formulated a hypothesis that the change in hemodynamic indicators and HRV indicators under the influence of various environmental factors of a hormonal nature occurs in students.
The study aims to analyze the characteristics of hemodynamic parameters and their wave structure in students of different sexes using the “Rheoplethysmograph RPG-202” measuring stand. Heart rhythm serves as a universal physiological response to both internal and external influences (9, 10), providing crucial insights into the functional regulation of vital processes in both normal and pathological conditions. As part of a complex regulatory system, the heart dynamically adjusts to fluctuations in homeostasis, with its physiological parameters offering an objective reflection of the body’s state (11). The timing of heart contraction cycles is determined by the rhythmic activity of pacemaker cells in the sinus node, which is modulated by nervous and endocrine control, as well as various humoral factors affecting the threshold of spontaneous depolarization. These influences ultimately alter the interval between heartbeats, impacting HR. Consequently, the regulatory mechanisms that influence HR also play a central role in determining HRV (12).
Literature review
Heart rate variability (HRV) refers to fluctuations in the duration of R-R intervals between consecutive heartbeats over specific periods (13). Today, HRV analysis is considered the most informative noninvasive approach for quantitatively evaluating autonomic regulation of HR.
A reduction in HRV is considered a sign of impaired autonomic regulation of cardiac function and is associated with a poor prognosis. The highest HRV levels are observed in healthy young individuals and athletes, while moderate values are found in patients with various organic heart conditions, including ventricular arrhythmias. The lowest HRV values are recorded in individuals who have experienced episodes of ventricular fibrillation.
Heart rate variability (HRV) research has highlighted its significance in assessing autonomic control of cardiac function. Studies on intrauterine fetal damage indicate that severe disturbances in fetal heart rhythm are often preceded by alterations in rhythm structure. The foundational work of Sayers et al. in 1973 introduced the concept of physiological fluctuations in HR, sparking further investigation into HRV. During the 1970s, short-segment rhythmocardiogram studies in patients with diabetic polyneuropathy contributed to a deeper understanding of autonomic regulation (14).
A pivotal breakthrough occurred in 1978 when Wolf M.W. et al. published the first study linking HRV to mortality in myocardial infarction patients. In 1981, Akselrod et al. introduced spectral analysis as an advanced method for HRV assessment. Early HRV studies were limited to basic indicators, such as the extent of sinus arrhythmia, differences between minimum and maximum R-R intervals, and the standard deviation of R-R intervals over short ECG recordings (2–5 minutes). These initial analyses were constrained by labor-intensive processes and technological limitations.
With the advent of Holter monitoring and the development of high-speed computing, HRV assessment expanded to 24-hour continuous monitoring, allowing for the inclusion of circadian (daily) variations in biological rhythms. This extended recording period reduces susceptibility to random external influences and enhances diagnostic accuracy. As a result, leading manufacturers of Holter monitors have incorporated specialized software for HRV analysis, improving clinical and research applications.
Extensive research on HRV by cardiologists worldwide has highlighted the necessity of standardizing terminology, refining measurement techniques, and defining HRV indicators under both normal and pathological conditions. To address this, in May 1994, a working group from the European Society of Cardiology and the North American Society of Cardiac Pacing and Electrophysiology convened to formulate a report establishing standardized protocols for HRV measurement, physiological interpretation, and clinical application (15).
Methodology
The work was carried out at the interdepartmental laboratory of the Faculty of Natural Sciences and Physics and Mathematics of the Oleksandr Dovzhenko Glukhiv National Pedagogical University. The study involved female students aged 18–21 years (m ± 20.5). A total of 15 people were examined, and 45 measurements were made.
All students participated in the study voluntarily; according to the medical examination data, they were practically healthy and had no acute or chronic diseases. Before performing the tasks, the students were informed about the purpose and objectives of the measurements.
The research adhered to the fundamental bioethical principles outlined in the Council of Europe Convention on Human Rights and Biomedicine (04.04.1997), the Helsinki Declaration of the World Medical Association on Ethical Principles for Medical Research Involving Human Subjects (1994–2008), and the Order of the Ministry of Health of Ukraine No. 690 dated 23.09.2009.
Measurements were carried out from 8:00 to 11:00 in the morning in the same remote auditorium. The air temperature was maintained at 20–230 °C.
Analysis of the menstrual flow (filling out a questionnaire) and study of phases using a test microscope were carried out 3 times (3 phases).
The measurement procedure for all individuals was standard. First, an instruction was given (5–7 minutes); then HR, BP, and rheogram measurements were taken under different conditions (sitting, standing, and after psycho-emotional stress).
Heart rate (HR) and blood pressure (BP) were measured using an electronic tonometer with a pulse meter function.
Measurements were performed using the Korotkov method:
1. The subject was seated with his right side to the table. Placing his right hand on the table.
2. A cuff was placed on the middle third of the bare shoulder so that its lower edge was 2–2.5 cm above the cubital fossa, and a finger was passed between the cuff and the surface of the shoulder. The bulb valve was screwed in, and the place of clear arterial pulsation was palpated in the elbow bend, and a stethoscope was placed in this place.
3. Using a bulb, the pressure in the cuff was gradually increased by 20–30 mm Hg. above the moment of disappearance of tones.
4. Opened the screw valve, reducing the pressure in the cuff at a speed of 2 mm Hg in 1 second, and monitored the manometer readings. The manometer readings at the moment of the first sound in the artery correspond to systolic pressure.
The study of HRV indicators was carried out using the author’s developed stand “Rheoplethysmograph RPG-202.” This installation included an Arduino Uno microcontroller, a tetrapolar two-channel rheoplethysmograph RPG-202, and laptop.
Arduino is a versatile hardware computing platform, consisting of an input/output board and a development environment based on the Processing/Wiring language. It can be utilized for creating autonomous interactive devices or interfacing with software applications on a computer, such as Adobe Flash, Processing, Max/MSP, Pure Data, and SuperCollider.
The core of the Arduino board includes an Atmel automatic voltage regulator (AVR) microcontroller along with wiring components for programming and integrating with external devices. Many models feature a linear voltage stabilizer of +5 V or +3.3 V, while clocking is managed by a quartz resonator operating at either 16 MHz or 8 MHz. The microcontroller is equipped with a pre-installed bootloader, eliminating the need for an external programmer.
In terms of programming, all Arduino boards fundamentally utilize RS-232 (serial communication), though its implementation varies across different versions. Newer models are programmed via USB, enabled by the FTDI FT232R USB-to-Serial converter chip. The Arduino Uno, however, integrates an Atmega8 controller in an SMD package as the converter, allowing developers to configure the platform for immediate recognition as a mouse, joystick, or other input device with customizable control signals.
Arduino boards provide access to a substantial number of microcontroller I/O pins for integration into external circuits. For instance, the Uno board (Figure 1) features 14 digital input/output pins, 6 of which support pulse width modulation (PWM) signal output, along with 6 analog input pins. These connections are accessible via contact pads or pin headers on the board. Additionally, various external expansion boards, known as “shields,” can be attached via pin connectors to enhance functionality.

Figure 1. Arduino Uno board.
Rheoplethysmograph RPG-202 (Figure 2). The RPG-202 tetrapolar dual-channel rheoplethysmograph is designed to record changes in impedance levels of patient body areas caused by redistribution of blood volumes, to measure absolute impedance values of these areas, as well as to study some volumetric indicators of blood flow and stroke volume and pulse wave volume in the extremities (16).
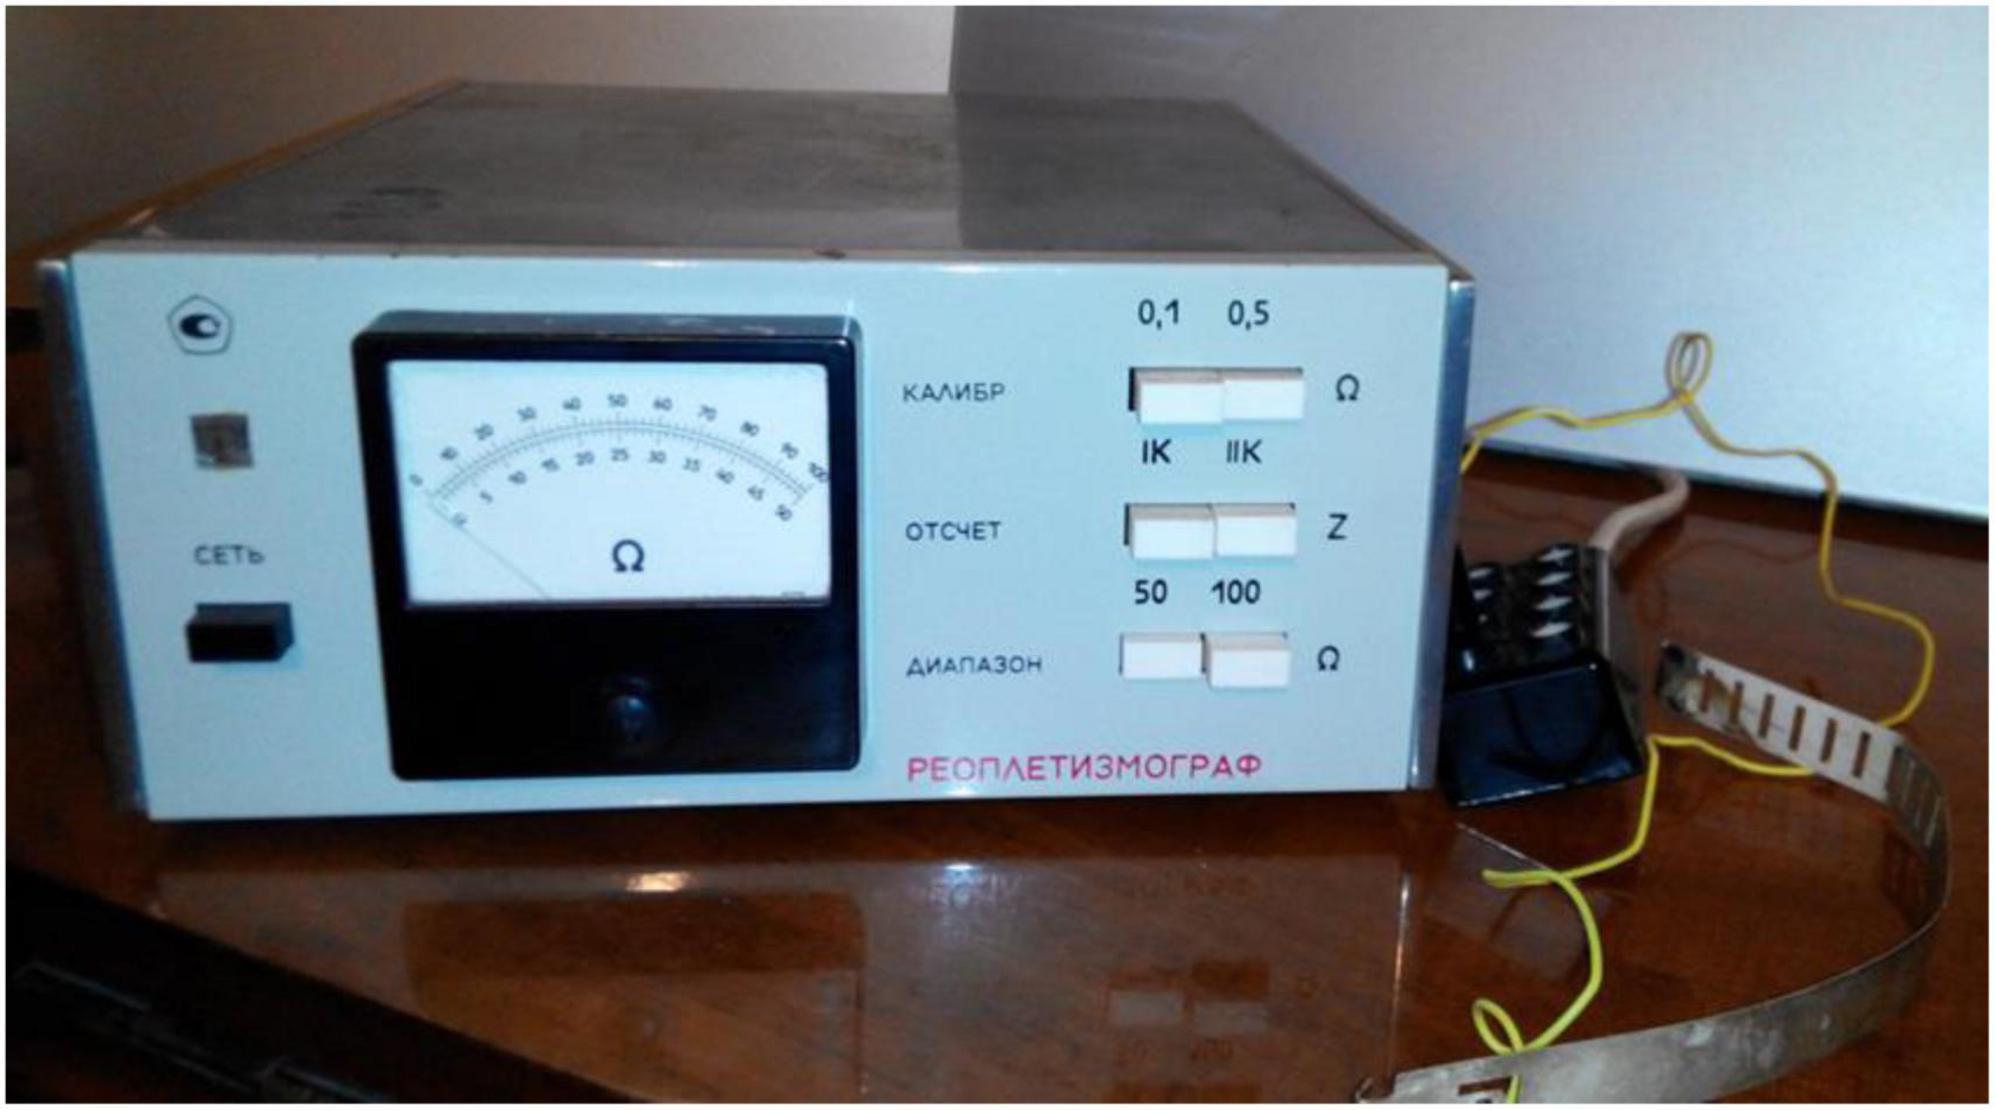
Figure 2. Tetrapolar two-channel rheoplethysmograph RPG-202.
The device allows you to assess vascular tone and determine the pulse wave distribution velocity. It can be used in laboratory and clinical conditions to study the circulatory system in humans and animals (normally and pathologically), as well as in long-term experiments, in the interaction of various functional and pharmacological tests, etc.
With the help of this rheoplethysmograph, it is possible to diagnose various lesions of the cardiovascular system, cerebral circulation disorders, various peripheral thromboses, etc., using the bloodless method of “impedance plethysmography.”
When measuring with the above method, the studied area of the body, placed between the electrodes, is probed with a high-frequency current, which creates a certain resistance. The change in this resistance during the inflow and outflow of blood (which has a specific resistance significantly different from the resistance of the tissue) is converted into an electrical signal and recorded in our case by an analog-to-digital converter based on Arduino Uno.
Rheography is a non-invasive technique used to evaluate organ blood supply by monitoring changes in tissue electrical resistance, which fluctuate due to variations in blood volume. Since blood has the lowest electrical resistance among biological tissues, increased perfusion results in a corresponding decrease in resistance. To obtain a rheogram, a low-intensity alternating current (typically in the milliamperes range) with a frequency of 50–100 kHz is applied to the body via a specialized generator, enabling precise measurement of circulatory dynamics.
N. Mann is credited with the inception of the geographical technique in 1937, which later evolved into rheographic methods through the contributions of researchers like A. A. Kedrov and T. Yu. Lieberman during the 1941–1949 period. The further advancement and clinical adoption of rheography were notably driven by Austrian scientists W. Holzer, K. Polzer, and A. Marko. They published the first comprehensive monograph, Rheokardiographie (17), which detailed the technical dimensions of the method, including circuit diagrams and specifications for alternating current generators, and showcased its clinical applications in various cardiovascular disorders. Additionally, Y. T. Pushkar made a significant impact by developing a domestically produced rheographic device and enhancing the recording technique for rheograms.
A specific clinical task determines the area of study, and accordingly, the place of application of electrodes. There are rheographies of the lungs, brain vessels (rheoencephalography), limb vessels (rheovasography), etc. The fundamental principle of rheography is that alterations in blood flow within a specific area of the human body result in corresponding changes in electrical resistance. In other words, this method focuses on analyzing the pulsatile fluctuations in resistance.
An idea of pulse fluctuations in electrical resistance is obtained by taking into account (ratio) the base resistance of the studied area (total body resistance to the probing current with a frequency of 50-100 kHz). The overall impedance of a specific body region is made up of two components: a baseline, constant impedance that results from the overall blood supply and inherent tissue resistance, and a pulsatile impedance that arises from blood flow fluctuations during the cardiac cycle. The value of the pulse impedance is small; it is up to 0.5% of the total impedance. However, it is the pulse impedance that carries a large amount of diagnostic information.
Registration of rheograms. Registration of rheograms is carried out using rheography. The block diagram of the simplest rheograph is shown in Figure 3. It consists of a high-frequency generator (1), an amplifier and detector (3), and a resistor R, forming a voltage divider. Signal differentiation can be performed in analog form (using RC circuits or differentiating circuits on operational amplifiers) or digital form (using algorithms built on finite differences).
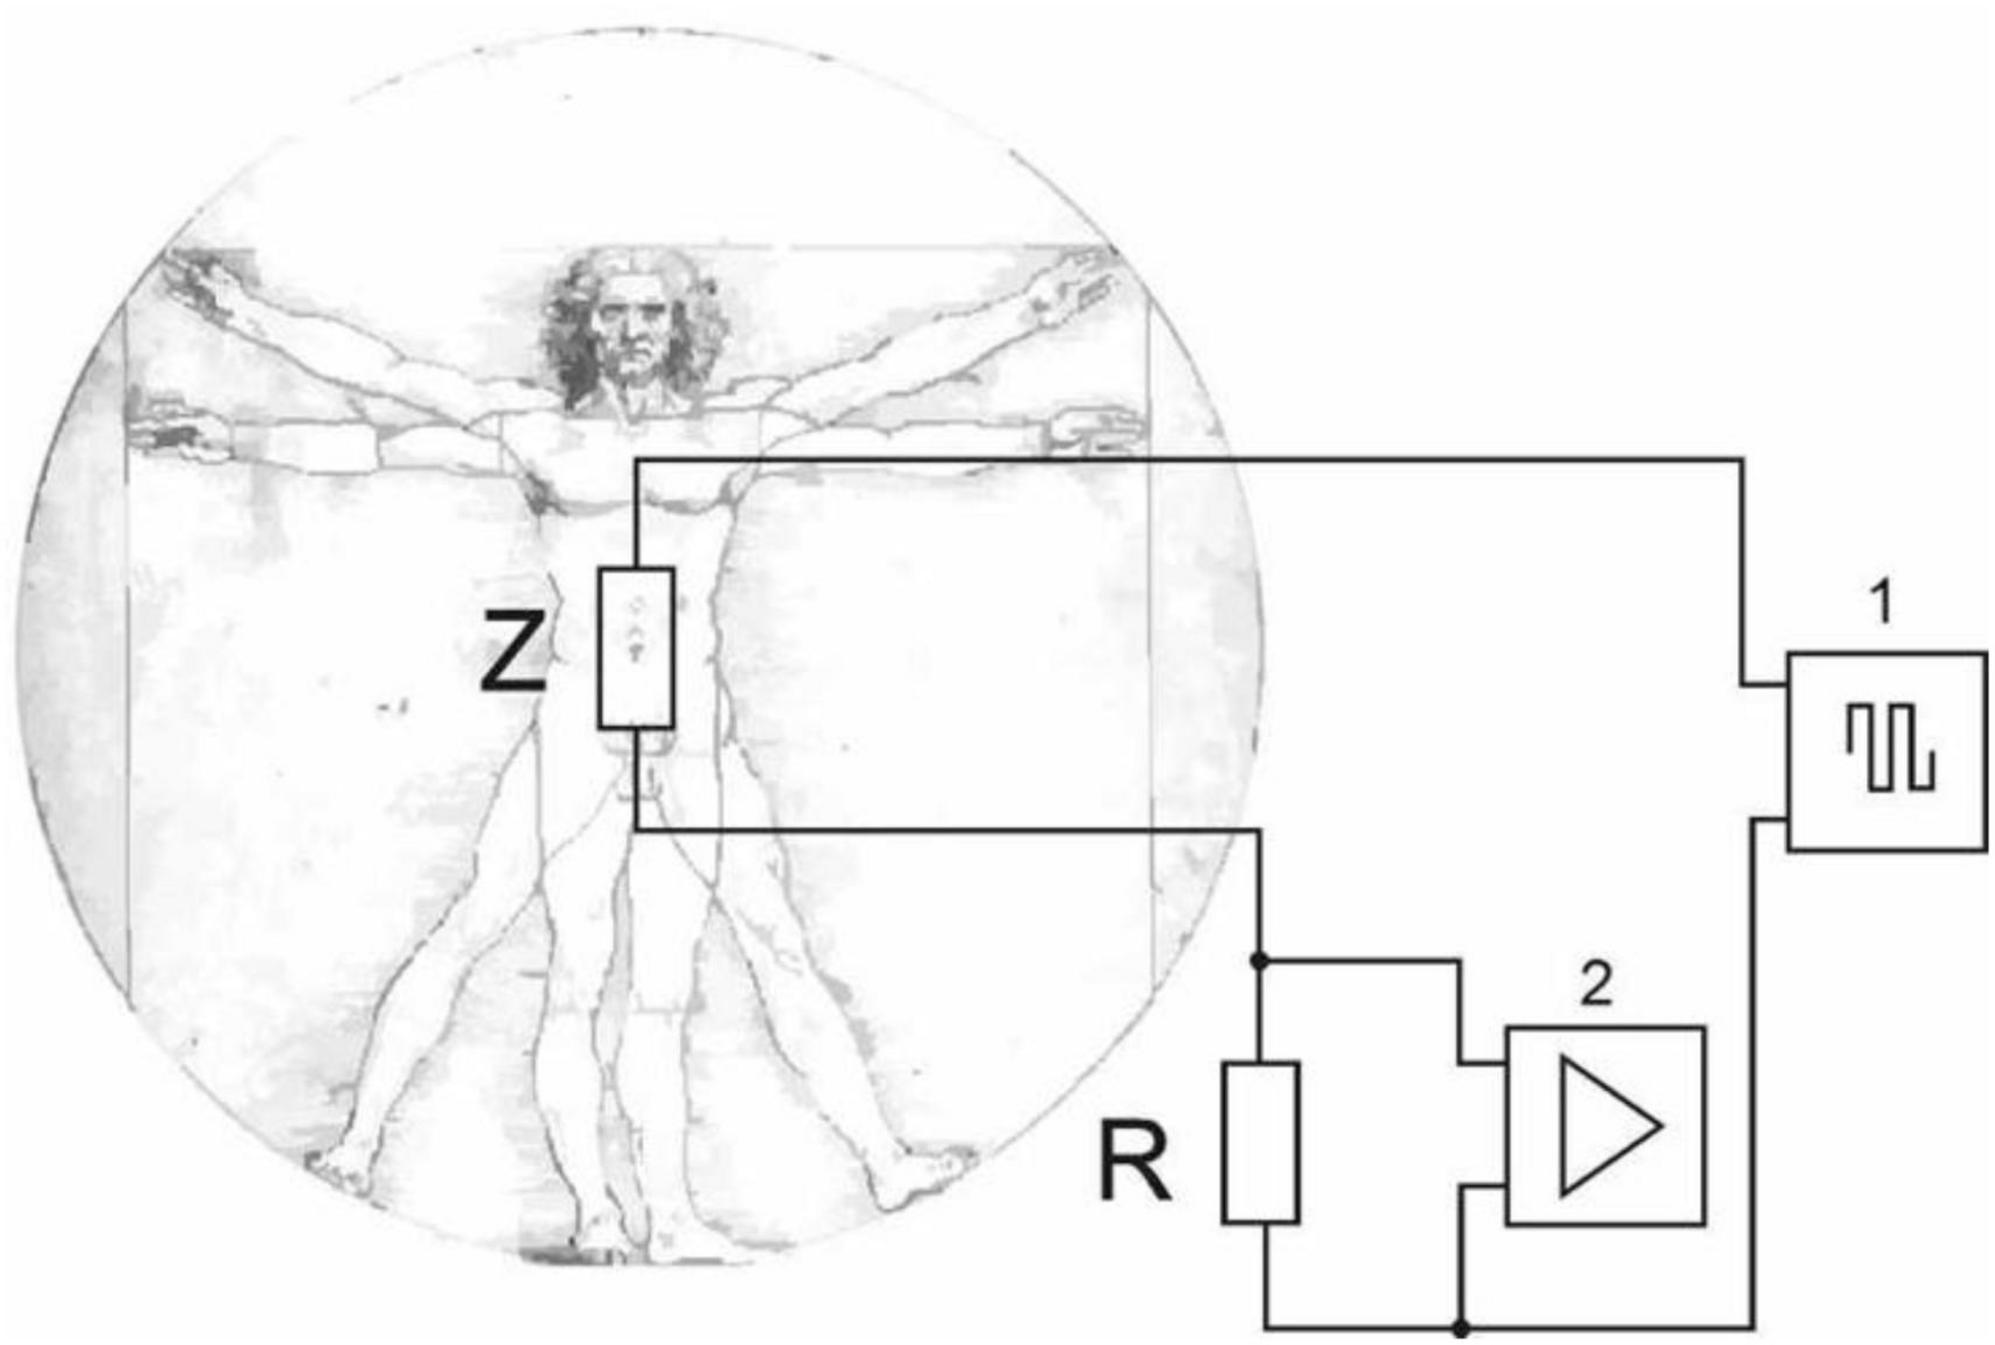
Figure 3. Bipolar technique of applying two electrodes.
In the bipolar method, two electrodes are used: one functions both as the current source and measurement sensor, while the other serves solely to deliver current. These electrodes are attached to the specific body area where the impedance Z is measured.
To minimize the contact resistance between the electrode and the skin, methods analogous to those used in ECG recordings are employed. With the tetrapolar technique, a pair of measuring electrodes defines the studied area, while a separate pair of current electrodes, positioned outside this zone, compensates for the generated voltage. This approach increases accuracy by greatly reducing the effects of contact resistance (thus eliminating the need for pads moistened with salt or alkaline solutions and the use of electrode paste) as well as electrode polarization. Consequently, it enables highly precise impedance measurements of deep tissues, and the data on baseline impedance provide a reliable quantitative assessment of key hemodynamic parameters.
A rheogram is a graphical representation that captures the pulsatile variations in electrical resistance. When blood flow increases, the curve’s amplitude rises, and when blood flow decreases, it falls—in effect, recording impedance dynamics in reverse polarity. Rheograms are typically recorded in a warm room, 1.5–2 hours after a meal or on an empty stomach, with the subject lying supine after a 15–20-minute rest. Alongside the rheogram, an ECG is recorded using the standard II lead, and sometimes an phonocardiography (FKG) is captured at the V point within a mid-frequency range. It is advisable to record the rheogram during breath-holding with incomplete exhalation. The recording is performed using a tape threading mechanism moving at 25–50 mm/s (occasionally 100 mm/s), and a calibration signal is often set to a scale of 0.10 m, corresponding to 10 mm.
The rheogram can be divided into two distinct phases: the systolic phase, characterized by an ascending curve due to blood inflow, and the diastolic phase, featuring a descending curve corresponding to venous outflow.
Qualitative and quantitative assessment of rheograms is reduced to measuring and describing the amplitude and time parameters of the curve, which reflect the state of vascular tone, their elasticity, and the magnitude of the stroke volume.
During qualitative assessment, multiple aspects of the curve are evaluated. This includes its overall contour; the distinctive patterns of the rising (anacrotic) and falling (catacrotic) segments; and the precise shape of the apex, which may be rounded, pointed, exhibit a plateau, or even form a saddle shape. In addition, attention is given to the intensity and count of supplementary waves along the descending portion of the curve, as well as noting whether a presystolic wave is present or absent.
Results or findings
In the process of working with the equipment, we created a measuring complex that combined the RPG-202 rheoplethysmograph, which outputs an analog signal, converted it into a digital one, and transmitted it to a PC via the Arduino Uno microcontroller and the virtual device “Rheograph” created in the LabVIEW Biomedical Toolkit (Figure 4). Considering that all components of the complex except the last one are described above, we will focus on the description of the developed virtual device (Figure 5).
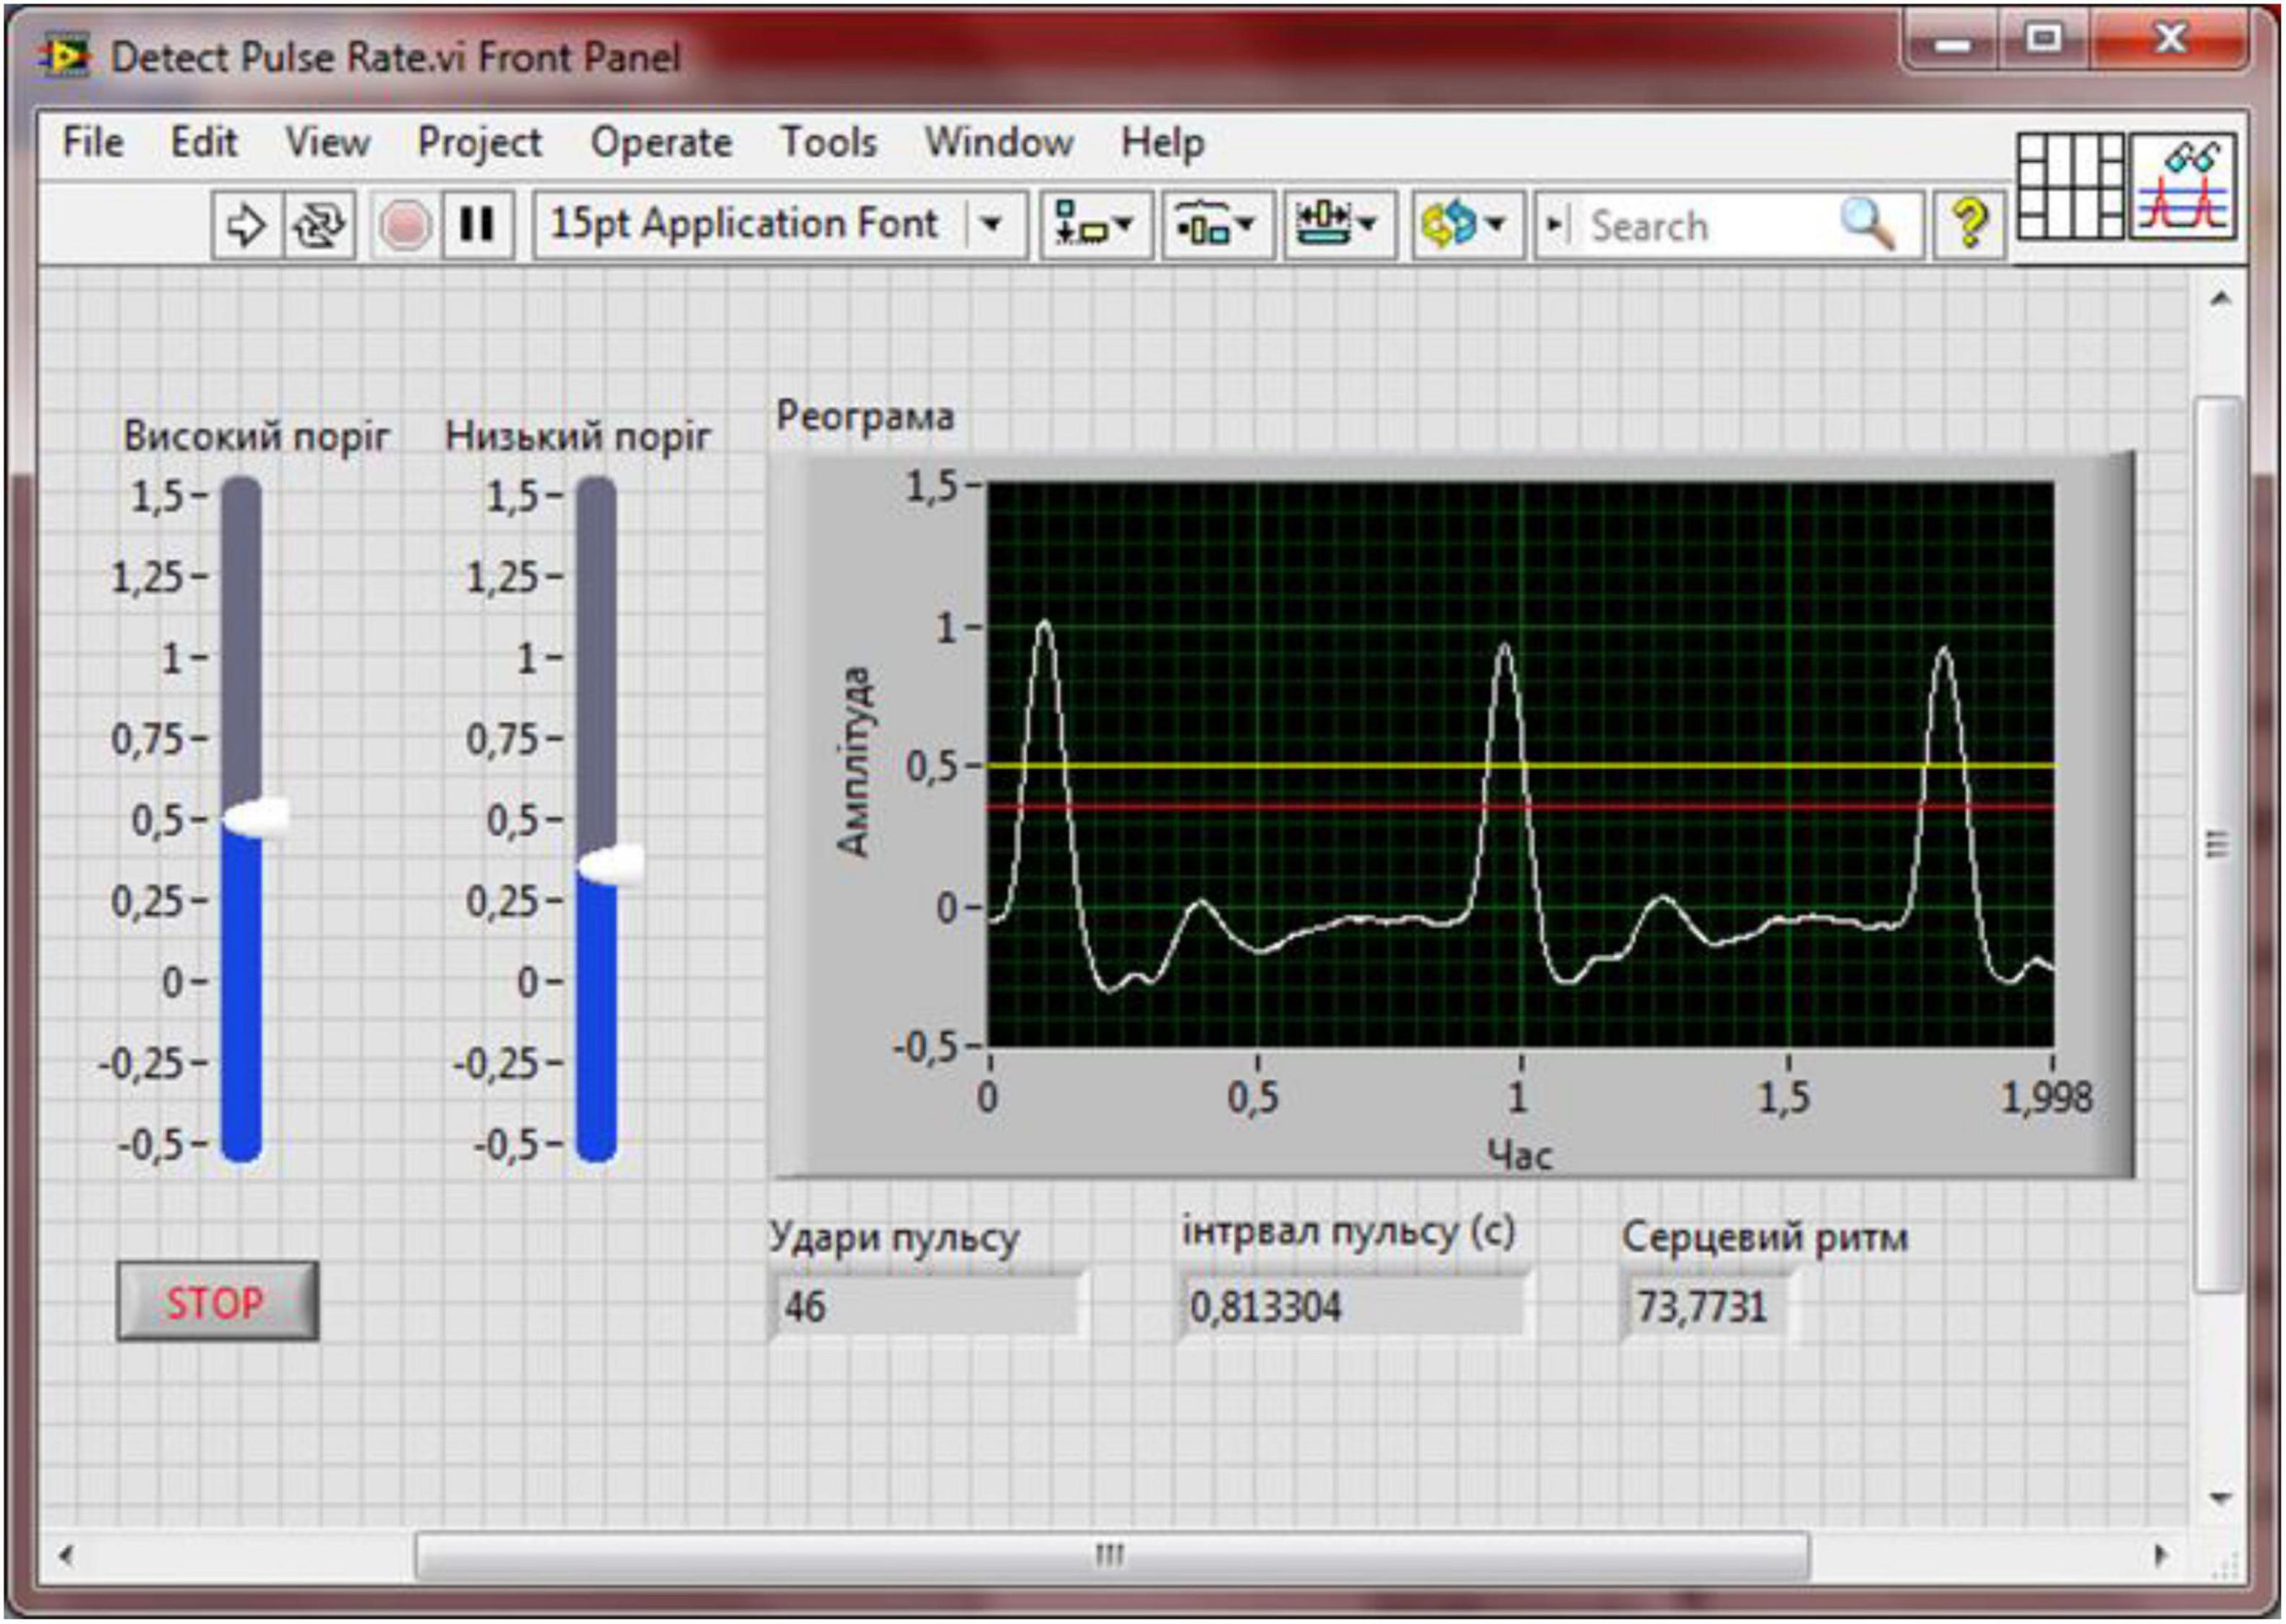
Figure 4. Block diagram of the Reograph enterprise.
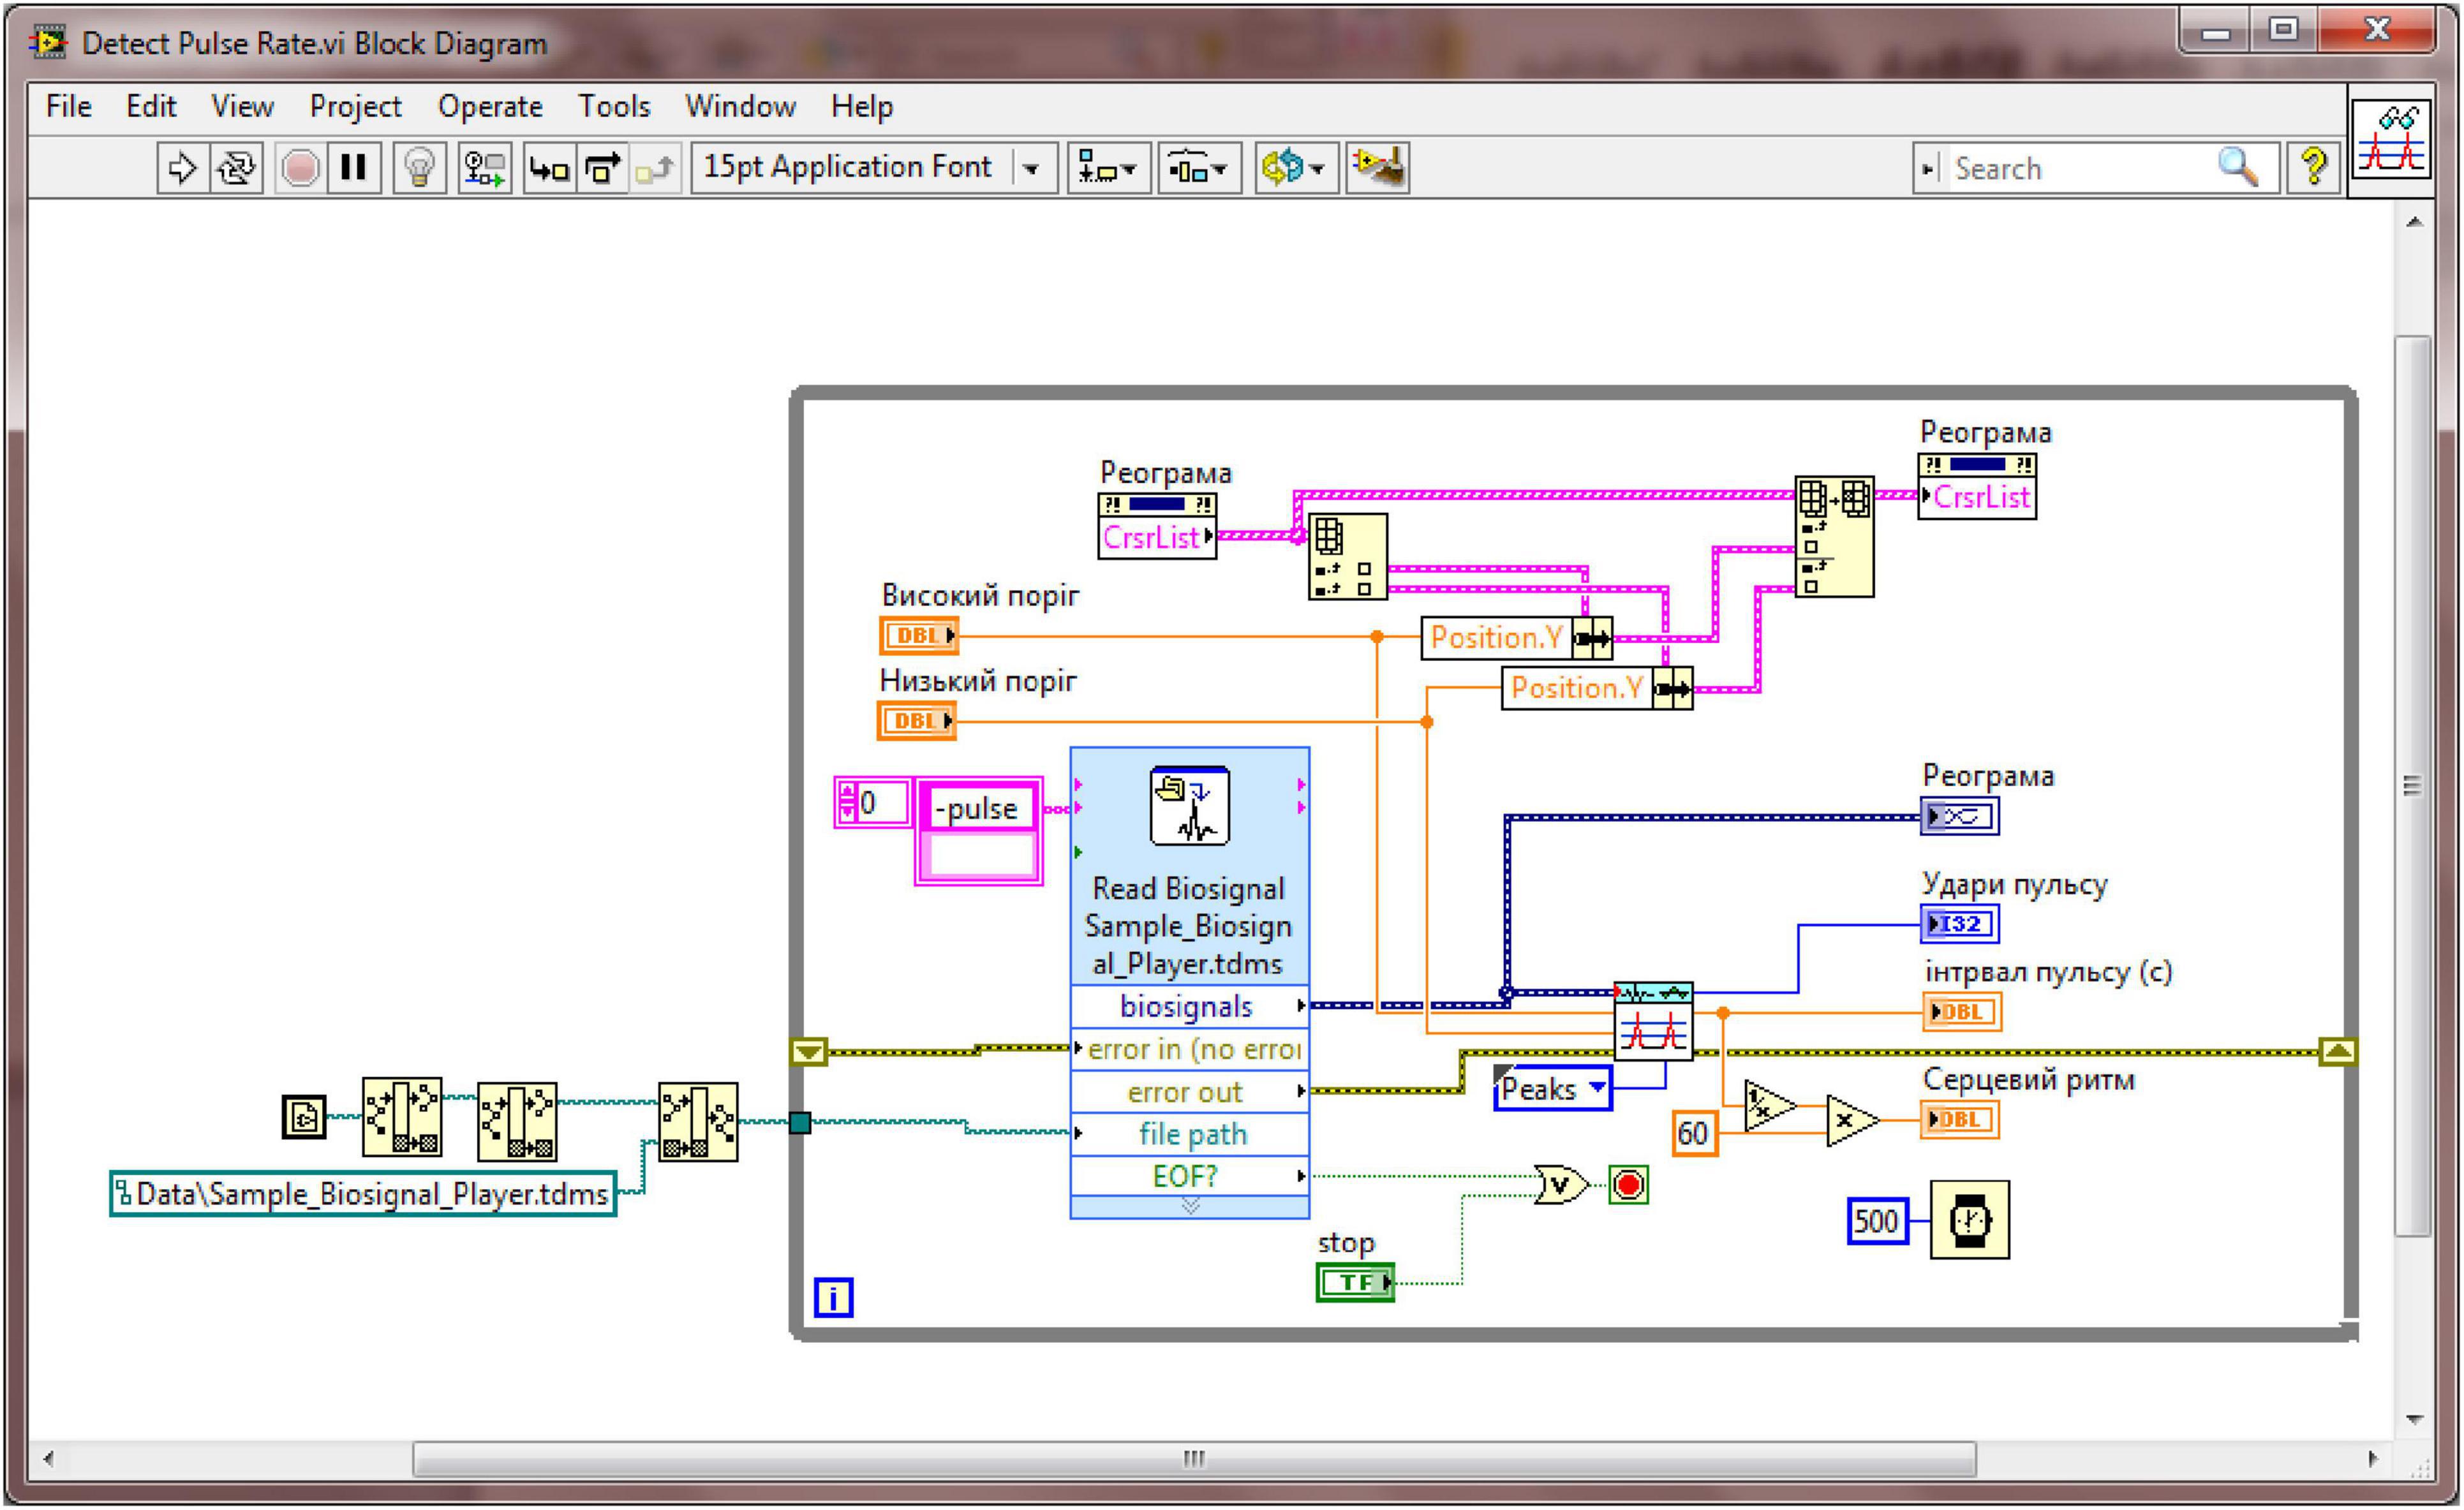
Figure 5. Front panel of the virtual device “Reograph.”
Statistical processing of the research findings involved handling differing data distributions appropriately. For the power of fluctuations in hemodynamic indicators, which did not follow a normal distribution, the medians and the 25th and 75th percentile limits were computed. In contrast, for BP measurements that were normally distributed, the mean values and their associated errors were calculated. As a result, paired comparisons using the Wilcoxon test and Student’s t-test were employed to estimate the probability of differences between values in different phases of the ovarian-menstrual cycle (OMC), while the non-parametric Spearman correlation coefficient was used to assess the correlations between indicators.
Between menarche and menopause, a woman’s overall condition is continually shaped by ongoing hormonal shifts. Although the impact of cyclic hormonal fluctuations on the reproductive system has been extensively studied, its effects on other organ systems—especially the cardiovascular system—remain only partially understood. Consequently, evaluating the cardiovascular status of women under diverse physiological conditions is crucial for accurately assessing, forecasting, and managing their health (10).
Additionally, the properties of central hemodynamics and its waveform structure are examined in women under orthopneic conditions during the various phases of the OMC.
When transitioning from a supine to a vertical position, all conditions exhibit a significant decrease in t-R-R, SI, and SOC (p < 0.001), together with a rise in total peripheral resistance (ZPO). The response of BP indicators varied according to the OC phase: in phases I and II, ABP, ABPd, and ABPser showed a significant increase, whereas in phase III, these changes were not statistically significant. As a result, the inter-phase differences in ABP and ABPser seen during supine rest disappeared upon standing, and t-R-R differences became apparent between phase III and phases I and II (676 ± 17 ms, 641 ± 16 ms, and 634 ± 11 ms, respectively, p < 0.05).
Thus, the most pronounced resting changes in central hemodynamics were observed during the luteal phase of the OC, but these differences vanished when the body shifted to an upright position. Upon standing, nearly all parameter values decreased significantly (p < 0.001). During this postural change, the following values were recorded: power of very low frequency heart rate oscillations (VLF) at 512 [313; 937] ms2, power spectrum of low-frequency heart rate oscillations (LF) at 521 [289; 771] ms2, power spectrum of high-frequency heart rate oscillations (HF) at 192 [108; 344] ms2, HFnorm at 28.5 [20.1; 36.6], and total power (TP) at 1286 [778; 2243] ms2. These variations in HRV indicators are attributed to the change in body position and the resulting redistribution of blood toward the lower extremities. Consequently, vascular tone increases to facilitate venous return, the HR accelerates due to sympathetic nervous system activation, and HRV correspondingly declines.
Interestingly, some HR indicators exhibited significantly greater reactivity (p < 0.01). Analysis of HR responses under orthostatic conditions (Table 1) revealed that during the luteal phase, the power of low-frequency HR waves increased noticeably, much more than the amplitude decrease observed in the ovulatory phase. Additionally, in phase III, there was a marked 60.8% increase in the maximum peak within the 0.04–0.15 Hz frequency range. It is noteworthy that HRV indicators within the 0.04–0.15 Hz frequency range exhibit the most pronounced reactivity under orthoprobe loading. Consequently, a detailed analysis of the power distribution of heart rhythm waves in this band was performed using a normalized median spectrogram (see Figure 6).
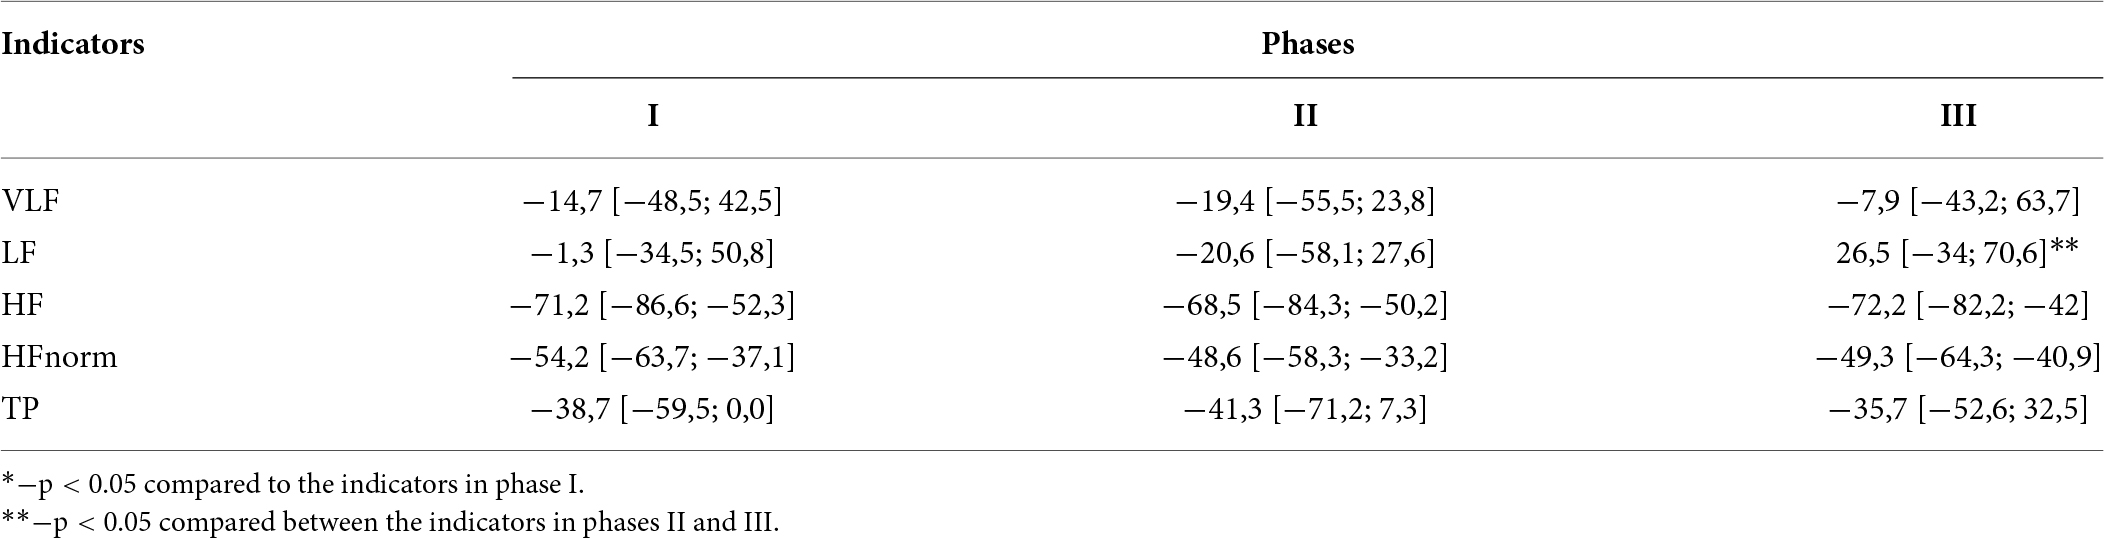
Table 1. Percentage responses of heart rate variability (HRV) parameters during orthoprobe testing across different phases of the female biological cycle.
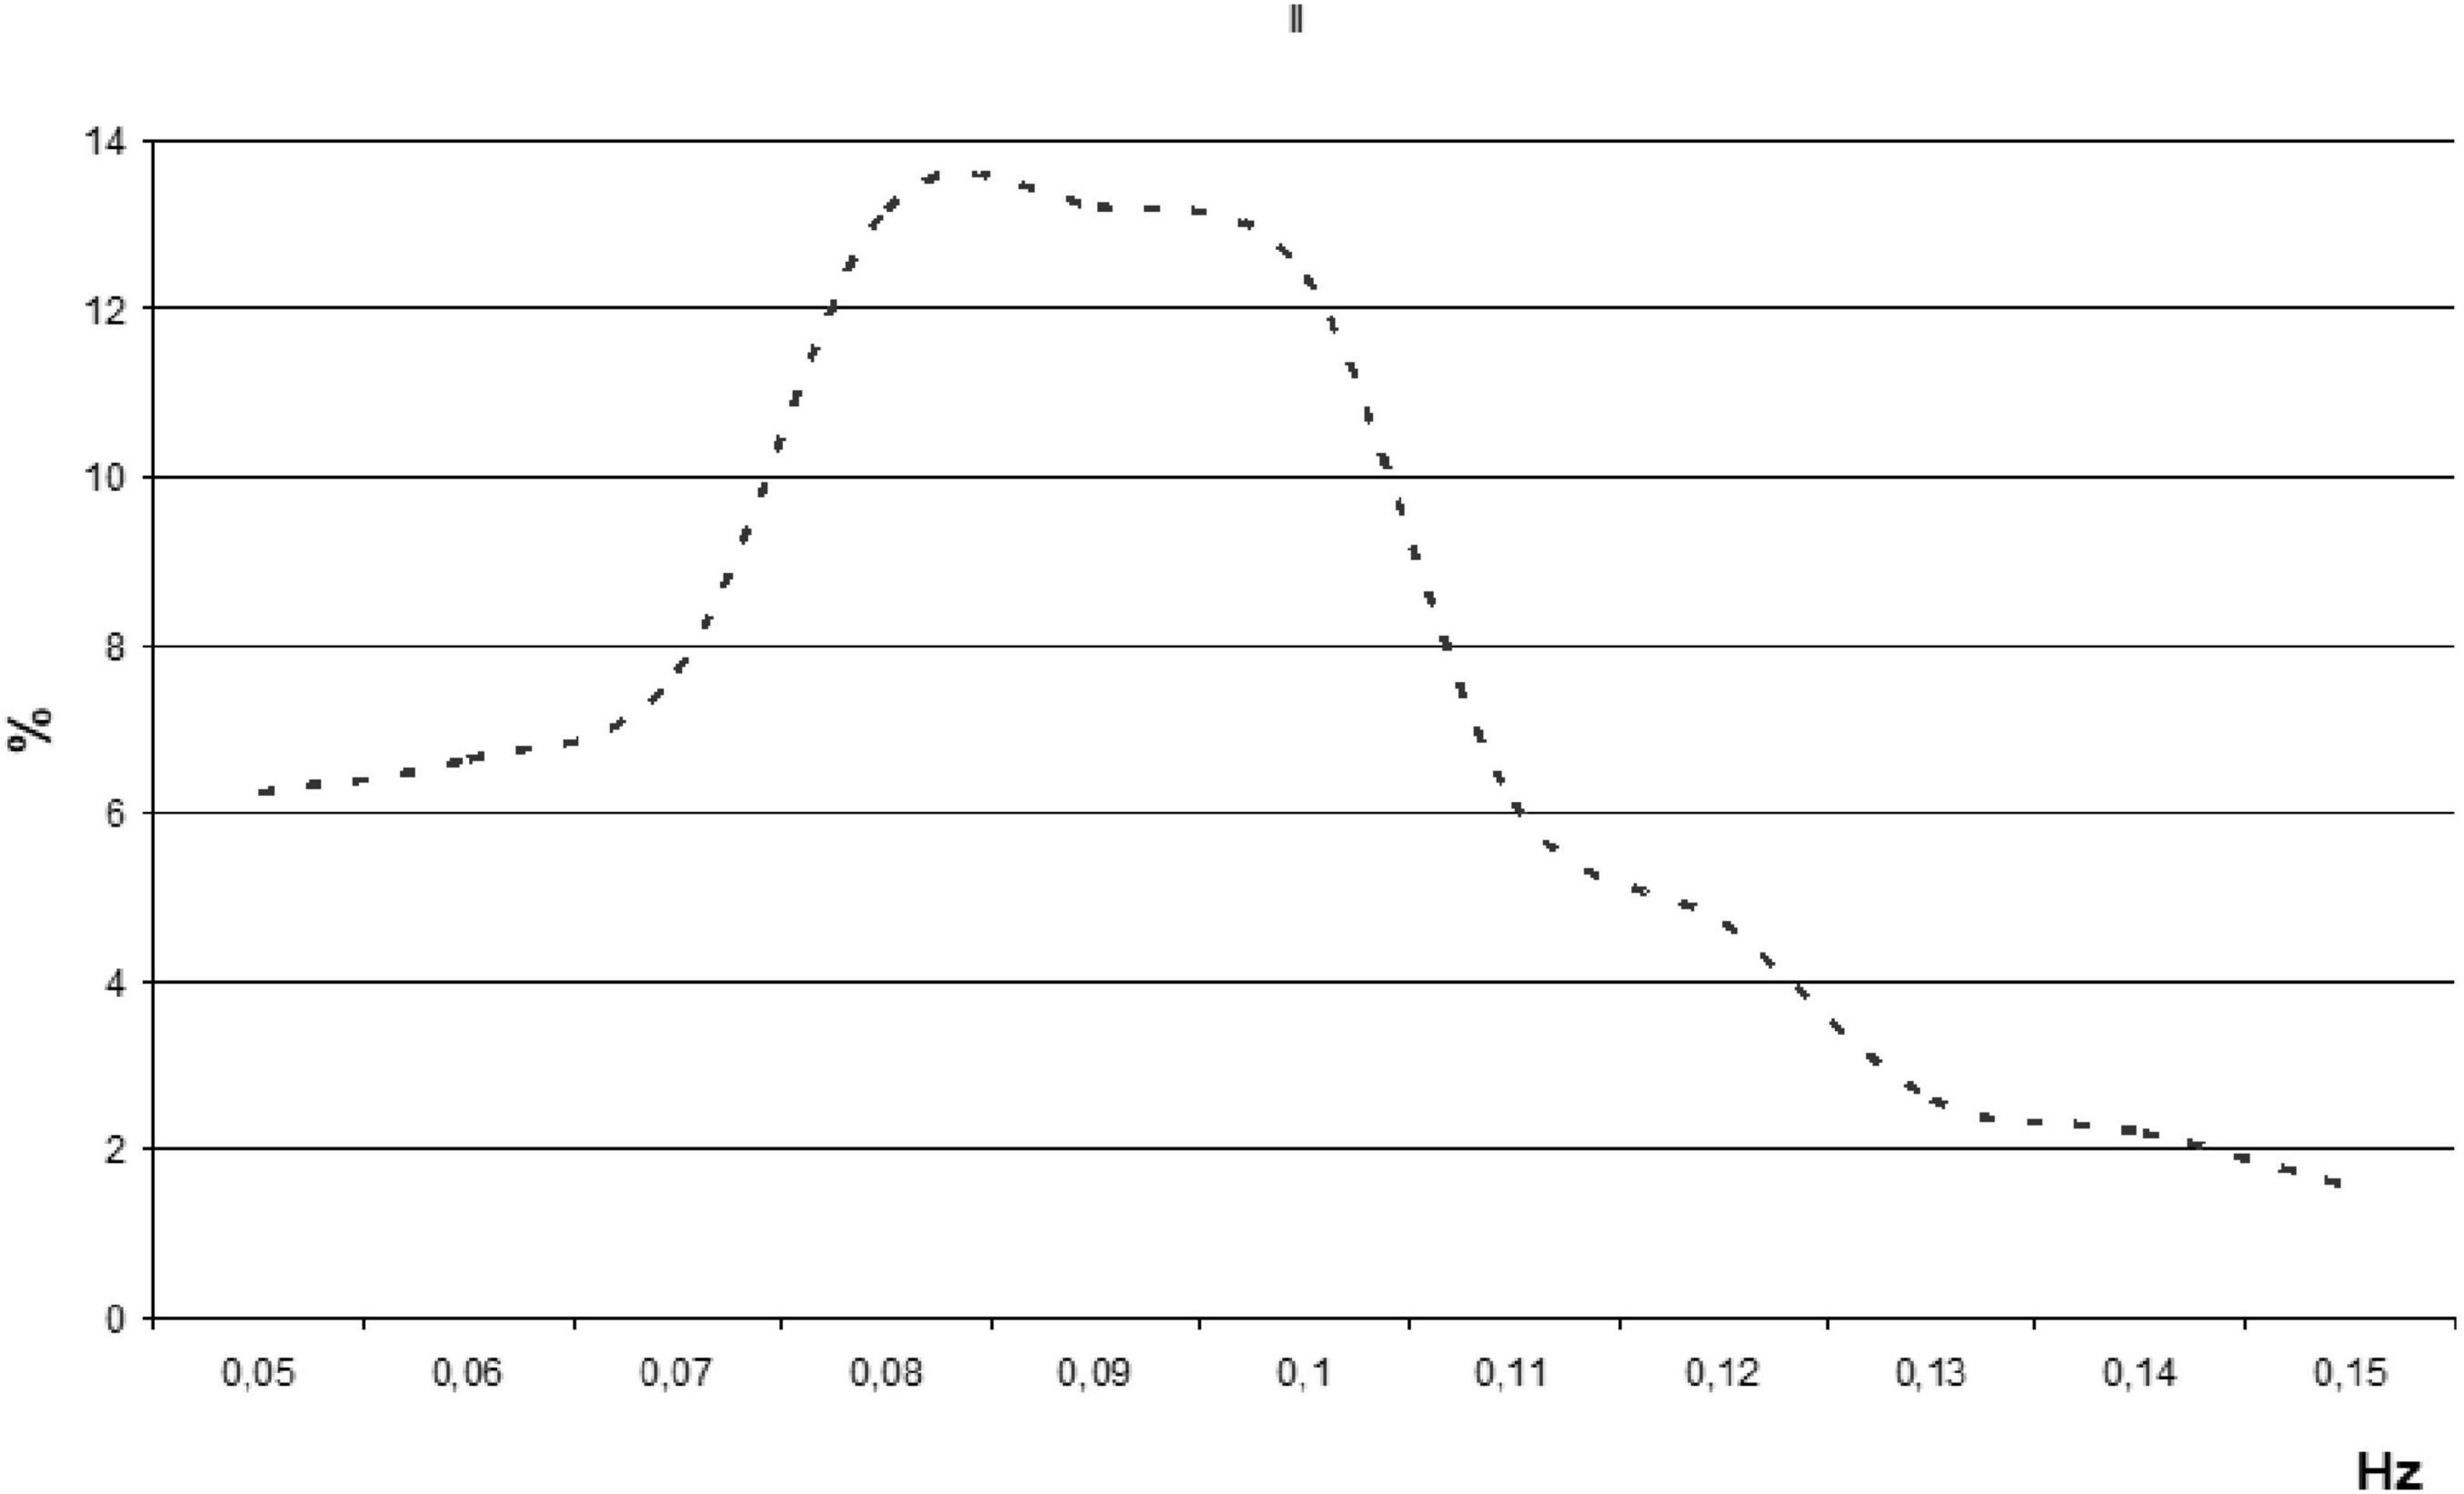
Figure 6. Median normalized spectrogram illustrating the power distribution of R-R interval fluctuations within the low-frequency range of heart rates (HRs) in women during orthopnea.
Results
It was observed that during orthopnea in women, the normalized spectral power within the low-frequency range of HR differed substantially at 0.08 and 0.1 Hz. The difference at 0.1 Hz may reflect sex-specific characteristics in spontaneous baroreflex sensitivity, pointing to a distinct mechanism in the generation of these waves (10). Additionally, significant individual variations in the HR wave structure were noted.
Conclusion
1. As a result of the study of scientific and methodological literature on the problem of research, we found that HRV allows us to assess the general condition of a person, identify the adaptive capabilities of the body, and analyze the psycho-emotional state. HRV can be used in therapeutic practice.
2. The tetrapolar method that employs a rheoplethysmograph is more precise since it substantially minimizes the effect of contact resistance, thereby enabling highly accurate measurements of deep tissue impedance. Furthermore, the baseline impedance data obtained allow for a reliable quantitative assessment of the key hemodynamic parameters, including stroke volume and minute blood circulation.
3. It was found that, while resting, women generally did not show marked differences in central hemodynamic indicators across the various phases of the ovarian menstrual cycle. However, noticeable variations were observed in the levels of autonomic nervous system (ATC) and ZPO. In particular, these parameters changed in phase III compared to phases I and II, a finding that is in agreement with numerous previous studies.
4. It was observed that the spectral analysis values of HR, recorded at rest while sitting, showed no significant differences. This suggests a heightened activation of the parasympathetic branch of the ANS during the follicular and luteal phases.
5. When the body moves into an upright position, nearly all parameter values drop significantly. This change in HRV indicators is linked to the body’s spatial orientation and the subsequent shift of blood toward the lower extremities. Consequently, vascular tone increases to support the return of blood to the heart, the HR speeds up due to sympathetic nervous system activation, and HRV correspondingly decreases.
6. During orthopnea in women, the normalized spectral power within the low-frequency HR range exhibited significant differences at 0.08 Hz and 0.1 Hz. Notably, the value at 0.1 Hz may reflect sex-specific characteristics of spontaneous baroreflex sensitivity, suggesting a distinct mechanism in the generation of these waves.
Permission to reuse and copyright
I grant permission to use the images in the article.
List of abbreviations
BP, blood pressure; BP, systolic blood pressure; BPd, diastolic blood pressure; BPser, mean blood pressure; ECG, electrocardiogram; SI, cardiac index; SOC, systolic blood volume; CSS, cardiovascular system; RR, respiratory rate; HR, heart rate; AMo, mode amplitude; HF, power spectrum of high-frequency heart rhythm oscillations; HFnorm, power spectrum of high-frequency oscillations in normalized units; LF, power spectrum of low-frequency heart rhythm oscillations; M, mean duration of cardio intervals; SDNN, standard square deviation; QRS, duration of QRS complex of electrocardiogram; VLF, power spectrum of very low frequency heart rhythm oscillations; AVR, automatic voltage regulator; PWM, pulse width modulation; FKG, phonocardiography; OMC, ovarian-menstrual cycle; ZPO, total peripheral resistance; TP, total power; ATC, autonomic nervous system.
Author Contributions
Olena Lutsenko conducted the experiment, collected statistics, and designed the article; Gregory Lucenko: created an experimental stand with Arduino and rheoplethysmography, reviewed literature sources, and designed the documentation for the article.
Funding
The entire study was funded by the authors of the article.
Acknowledgments
We express our sincere gratitude to our colleagues from the Faculty of Natural Sciences and Physics and Mathematics Education of the Oleksander Dovzhenko Glukhiv National Pedagogical University for the opportunity to place the equipment on the basis of the biological interdepartmental laboratory, with the subsequent conduct of the experiment.
Conflict of interest
The authors declare that the research was conducted in the absence of any commercial or financial relationships that could be construed as a potential conflict of interest.
References
1. Korkushko OV, Pisaruk AV, Shatylo VB, Lishnevskaya VY, Chebotarev ND, Pogoretsky YN. Analysis of heart rate variability in clinical practice: age aspects. Kyiv: Taras Shevchenko National University of Kyiv (2002). 192 p.
2. Milic MA. Comparison of pharmacologic and spontaneous baroreflex methods in aging and hypertension. Hypertension. (2009) 27(6):1243–51.
3. Pylyponova VV, Rikalo NA. Modeling of normative parameters of cardiointervalography in girls of different somatotypes depending on the features of the body structure. Biomed Biosoc Anthropol. (2011) 17:82–6.
4. Lewandowski J. Sex hormone modulation of neuropeptide Y and cardiovascular responses to stress in humans. In: Stress: Molecular Genetic and Neurobiological Advances. New York: Gordon and Breach Science Publishers (1996). p. 569–78.
5. Tsybenko VO. Blood circulation. In: Physiology with the Basics of Pathophysiology. Cherkasy: Cherkasy National University (2010). 295 p.
6. Princi TS. Parametric evaluation of heart rate variability during the menstrual cycle in young women. Biomed Sci Instrum. (2005) 41:340–5.
7. Capuano V, Bambacaro A, D’Arminio T. Correlation between body mass index and other risk factors for cardiovascular disease in women compared with men. Monaldi Arch Chest Dis. (2003) 4:295–300.
8. Kubichek WG. Impedance cardiography is a noninvasive method of monitoring cardiac function and other parameters of the cardiovascular system. Ann N Y Acad Sci. (1970) 2:724–32.
9. Shaparenko PP. Anthropometric and somatotypological characteristics of practically healthy urban adolescents of both sexes of the Ukrainian ethnic group. Bull Morphol. (2006) 3(1):339–41.
10. Ketel IJ. Microvascular function has no menstrual-cycle-dependent variation in healthy ovulatory women. Microcirculation. (2009) 16:714–24.
11. Yabluchansky NI. Variability of Heart Rate in the Assistance of a Practical Doctor. For real doctors. Kharkiv (2010). 131 p.
12. Akselrod SD, Gordon D, Ubel FA. Power spectrum analysis of heart rate fluctuation: a quantitative probe of beat-to-beat cardiovascular control. Science. (1981) 213(4503):220–2.
13. Bai X. Influence of the menstrual cycle on nonlinear properties of heart rate variability in young women. Am J Physiol Heart Circ Physiol. (2009) 297:765–74.
14. Glass L. Introduction to controversial topics in nonlinear science: is the normal heart rate chaotic? Chaos. (2009) 19:28–50.
15. Cooley RL, Montano N, Cogliati C. Evidence for a central origin of the low-frequency oscillation in RR-interval variability. Circulation. (1998) 98(6):556–61.
16. Popel SL, Tsap IG, Yatciv YN, Lapkovsky EY, Synitsya AV, Pyatnichuk DV. Special aspects of hemodynamic and reaction of erythrocytes in blood to standard physical load of different qualification female volleyball players. Pedag Psychol Med Biol Prob Phys Train Sports. (2017) 21(5):251–9. doi: 10.15561/18189172.2017.0508
17. Holzer W, Polzer K, Marko A. RKG Rheocardiography: A Method of Circulation’s Investigation and Diagnosis in Circular Motion. Wien: Wilhelm Maudrich (1946).
© The Author(s). 2026 Open Access This article is distributed under the terms of the Creative Commons Attribution 4.0 International License (https://creativecommons.org/licenses/by/4.0/), which permits unrestricted use, distribution, and reproduction in any medium, provided you give appropriate credit to the original author(s) and the source, provide a link to the Creative Commons license, and indicate if changes were made.