Introduction
Accurate body shape classification is essential. It is used in apparel design, ergonomic assessment, and virtual fitting. Traditional methods use linear measurements or 3D scan data. These data are analyzed with principal component analysis (PCA) and clustering. These techniques identify major body categories. However, they lack the ability to capture human morphological variability. Human shapes are often ambiguous. One study used an angle-based method for male upper bodies. It classified shapes into straight, hourglass, and torch types. This improves garment fit (1). Other studies use 3D features to develop statistical body categories. These categories improve size charts (2). Perception is also a factor. Adults often misperceive their body size. This happens frequently with higher body mass index (BMI) individuals. Misperception leads to body dissatisfaction (3). Recent studies focus on body shapes and apparel fit. Research in the United States examined overweight men and women. It identified distinct body types. It also found frequent fit problems in existing sizing systems (4, 5). Other models predict body shapes for Bangladeshi young men (6). These models use anthropometric data. Statistical shape analysis and PCA are common tools. They identify key morphological features. They also track growth patterns. One study applied these to Korean boys (7–9). Clustering techniques are also used. Some studies use 3D body scan data for military clothing (10). This helps optimize size distribution. Artificial intelligence (AI) advances have improved garment sizing. These systems predict fit and anticipate returns. They increase customer satisfaction (11). Overall, data-driven analysis is important. It creates accurate sizing systems. It improves garment fit for diverse populations.
Recent research has explored computational methods to improve garment design based on body shape variations. Marketing and sizing challenges caused by diverse anthropometry and body shapes have been highlighted in several studies (12). Wear trials and thermal simulations have been used to evaluate the human clothing environment system. These methods ensure that garments provide comfort and proper fit for different body shapes (13). Fuzzy logic and artificial neural networks have been applied to garment pattern design. They enable adaptive systems that account for individual body shape differences (14, 15). Deep learning techniques have also been used to classify garment images. This supports the integration of body shape information into automated design processes (16). Machine learning models have been employed to predict consumers’ garment fit satisfaction. They demonstrate the potential of data-driven approaches to optimize fit across various body shapes (17). The Adaptive Network Fuzzy Inference System has been applied to virtual fit evaluation of pants (18). Cluster size prediction systems using 3D body scan data have improved sizing for young women (19). Point-based modeling approaches have further enabled realistic simulation of human clothing interactions (20). Collectively, these studies show that AI, fuzzy logic, and 3D modeling can enhance personalized garment design and virtual fitting. Fuzzy-based classification has shown clear advantages over conventional clustering. Parametric 3D modeling of lower body shapes and whole body scans of overweight or obese individuals revealed distinct shape types and associated fitting challenges. These findings have supported the development of more inclusive sizing systems (21, 22). The methods achieved over 90% accuracy in new subjects, validating the effectiveness of integrated fuzzy and data-driven approaches (23, 24). Simulation models have also been applied to specialized garments, such as electromagnetic shielding clothing, enabling analysis of shielding effectiveness while accounting for body shape (25). Overall, fuzzy logic handles the uncertainty of human morphology. It bridges the gap between statistics and machine learning. Fuzzy-based approaches improve shape recognition and virtual fitting. They provide a reliable foundation for future apparel development.
Material and methodology
The research surveyed adult males aged 18–60 in Southern Vietnam. Participants had normal postures and no physical deformities. The group included workers, security guards, civil servants, and office staff. Data collection took place in Ho Chi Minh City. The research analyzed the data using international business machines (IBM) statistical package for the social sciences (SPSS) Statistics 21. A cross-sectional statistical method processed the measurement data. PCA extracted key factors. K-Means clustering classified body shapes. This classification used BMI, difference between chest and waist measurements (DROP), and waist-to-hip ratio (WHR) indices. CLO3D simulation software generated virtual avatars for each group. The research applied fuzzy logic techniques to predict body shapes. The developed model uses height and weight as input variables. It calculates BMI and classifies body types. This two-input fuzzy system increases speed and accuracy. It derives BMI from measurements and processes it through a fuzzy inference mechanism (Figure 1).
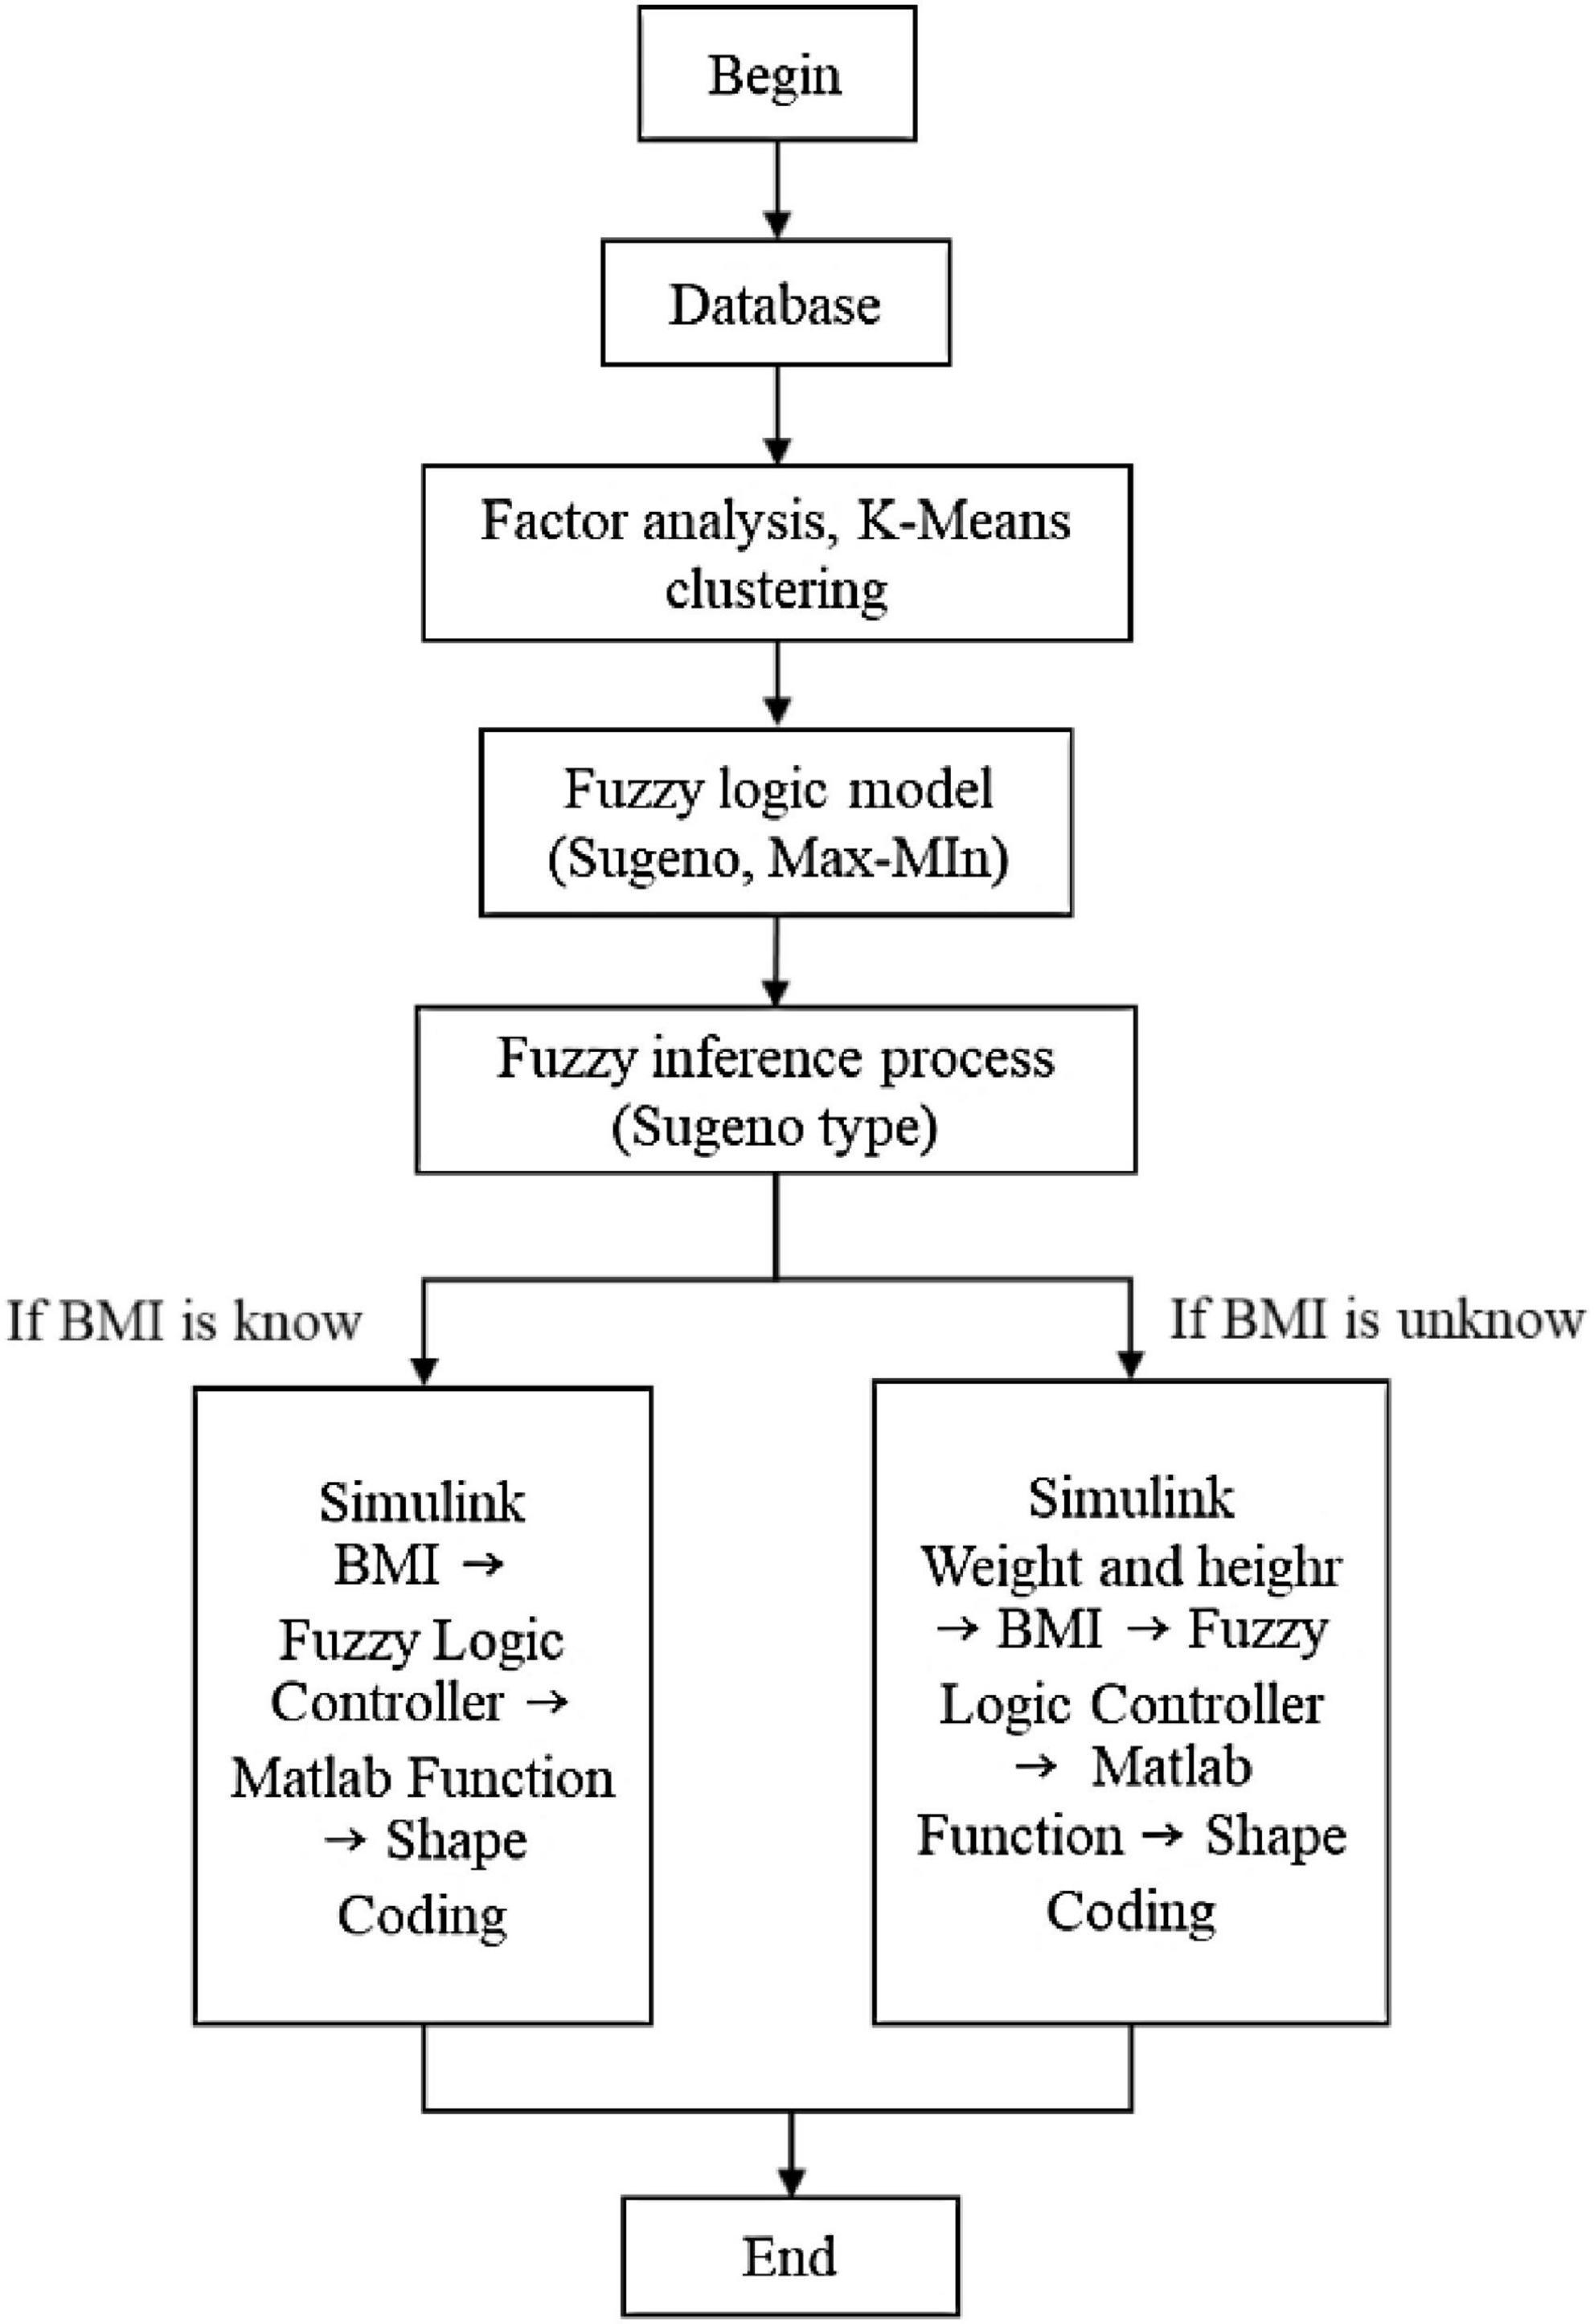
Figure 1. Research methodology.
Results and discussion
Calculation of the measurement sample
Measurement sampling included men aged 18–60 years. The research divided them into three physiological age groups: youth (18–25), adults (26–44), and middle-aged (45–60) (26). The youth group showed the highest variation in height (σ1 = 6.64 cm). Weight variation was higher in the adult and middle-aged groups (σ2 = 6.94 kg). These two groups had similar weight variability. Therefore, we combined the adult and middle-aged groups into one category for sampling. We calculated the final sample size using Equation (1) (27):
σ: Standard deviation
Choose confidence level 95%; t = 1.96; Δ1 = 1 (cm); σ1 = 6.64 (cm); Δ2 = 1 (kg); σ2 = 6.9 (kg).
n1 = 170 (people), n2 = 183 (people).
So, the total number of measurement samples needed for the study is 353 (people).
The principal component analysis
In Table 1, the research extracted four components with eigenvalues greater than 1 after rotation. These explain 80.756% of the total variance. They form the basis for identifying key measurements. The first component is “Dimensions related to the primary horizontal dimension.” It accounts for 43.362% of the variance. This group includes abdomen, shoulder, back, waist, hip, and bust girths, plus weight. Loadings range from 0.678 to 0.868. Abdomen girth has the highest loading. The second component is “Dimensions related to the primary vertical dimension.” It explains 20.350% of the variance. It includes height, inseam, sleeve length, and outseam. Loadings range from 0.739 to 0.900. Height has the strongest loading. The third component is “Dimensions related to the center back.” It contributes 10.231% of the variance. This includes center back length, wrist girth, and armhole depth. Loadings range from 0.609 to 0.875. The fourth component is “Dimensions related to the collar.” It explains 6.813% of the variance with a loading of 0.799. Correlation analysis shows all factors are independent. There is no overlap or multicollinearity among variables.
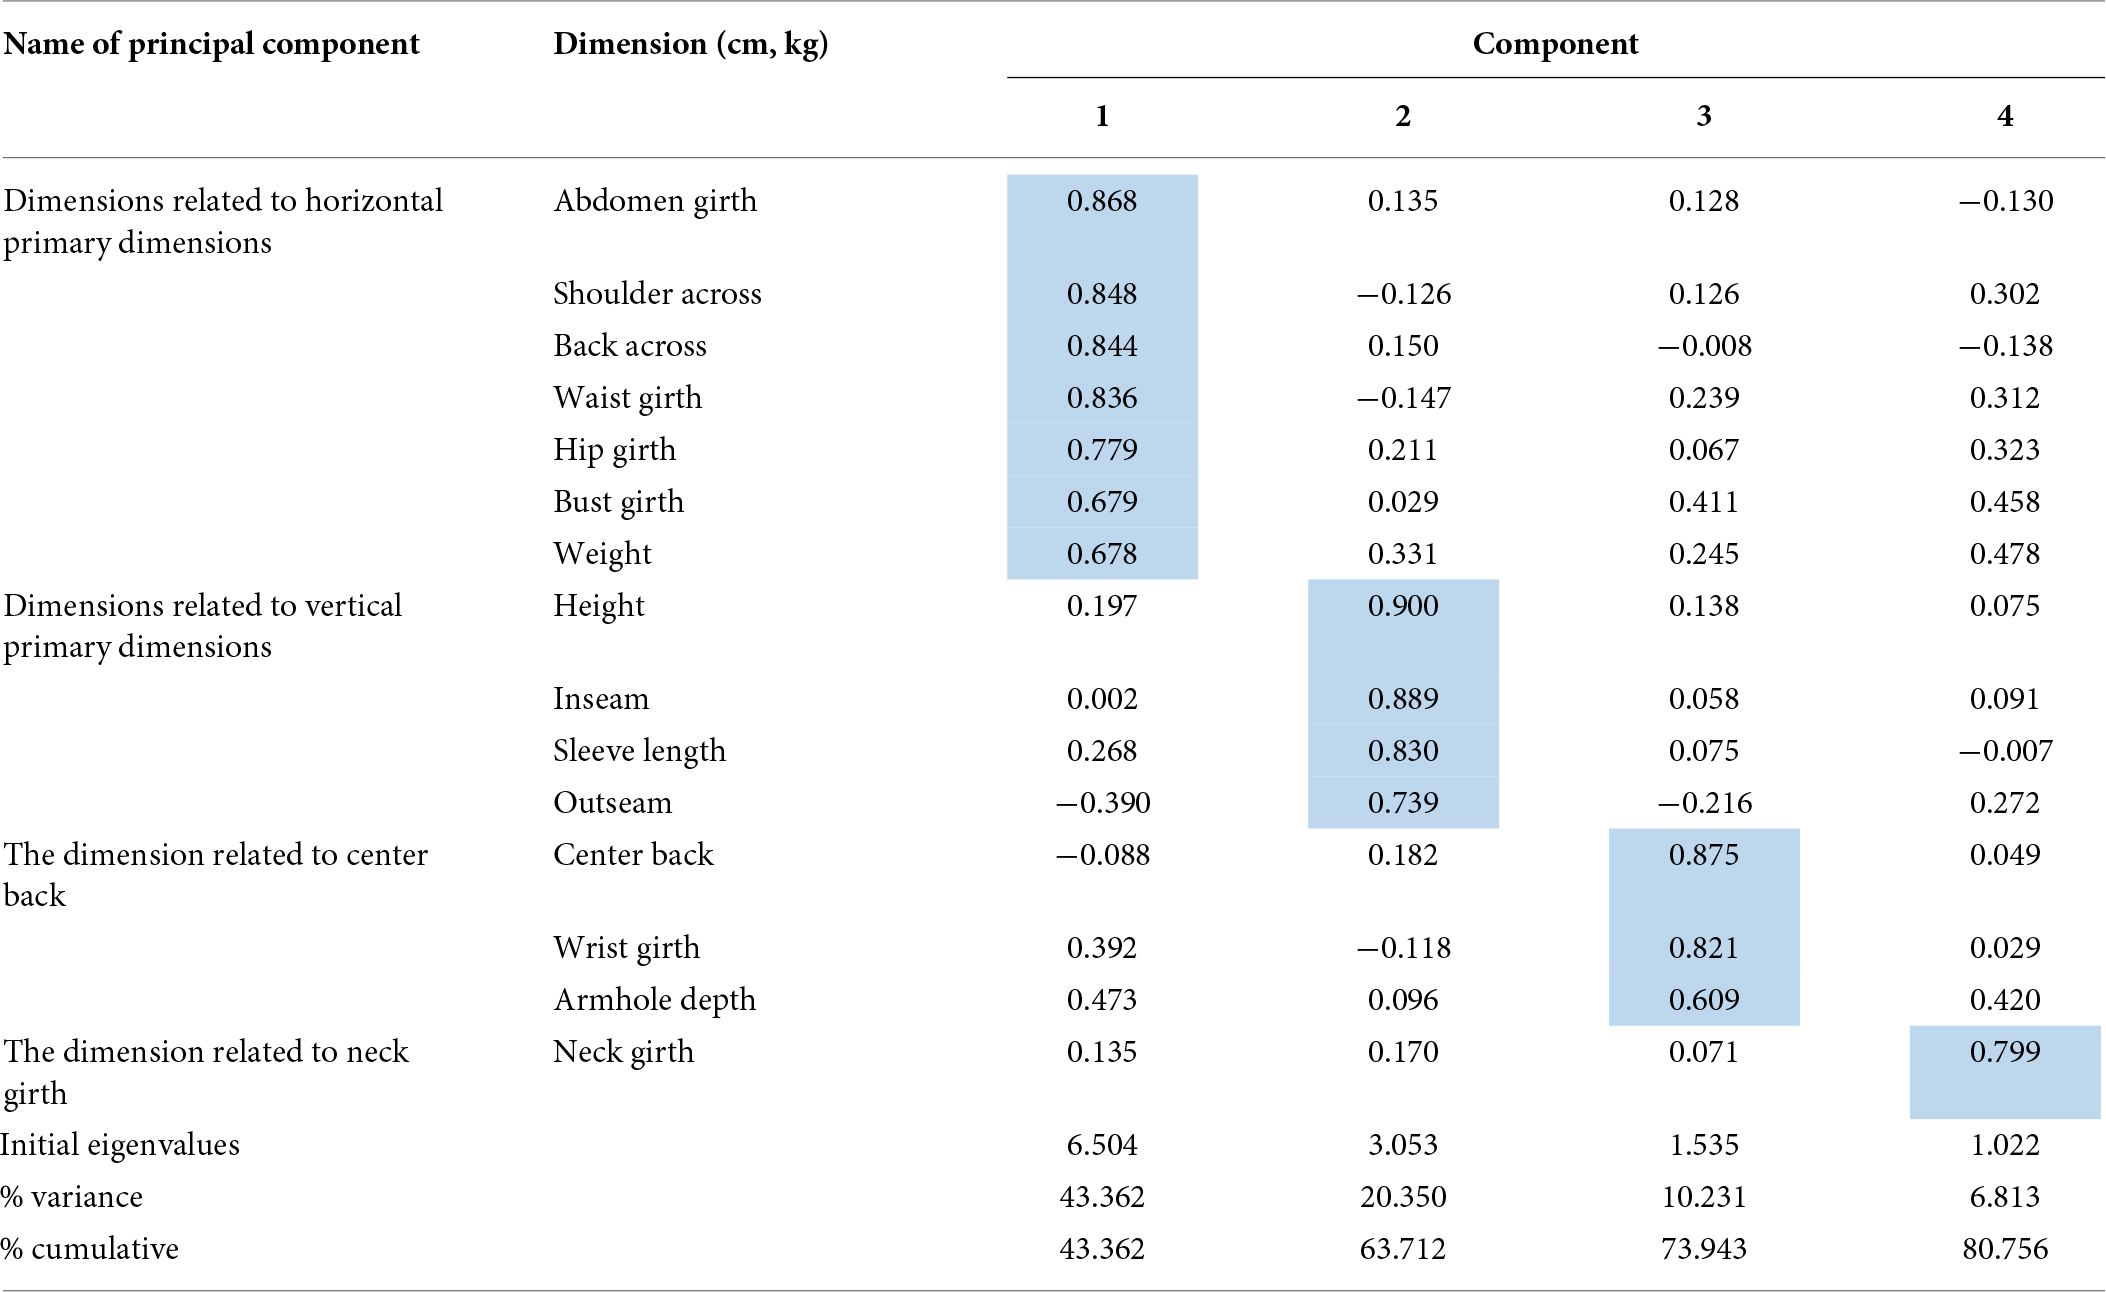
Table 1. Loading explains principal component analysis (PCA) results.
The principal component analysis
Cluster analysis shows that the first, second, and fourth principal dimensions follow a normal distribution. The third dimension does not. This indicates high body shape diversity (Figure 2). Variations exist in abdominal girth, shoulder width, and height. Differences also appear in sleeve, inseam, and outseam lengths. The clustering process creates a representative dataset. This supports the analysis of sample relationships and detailed body shape classification.
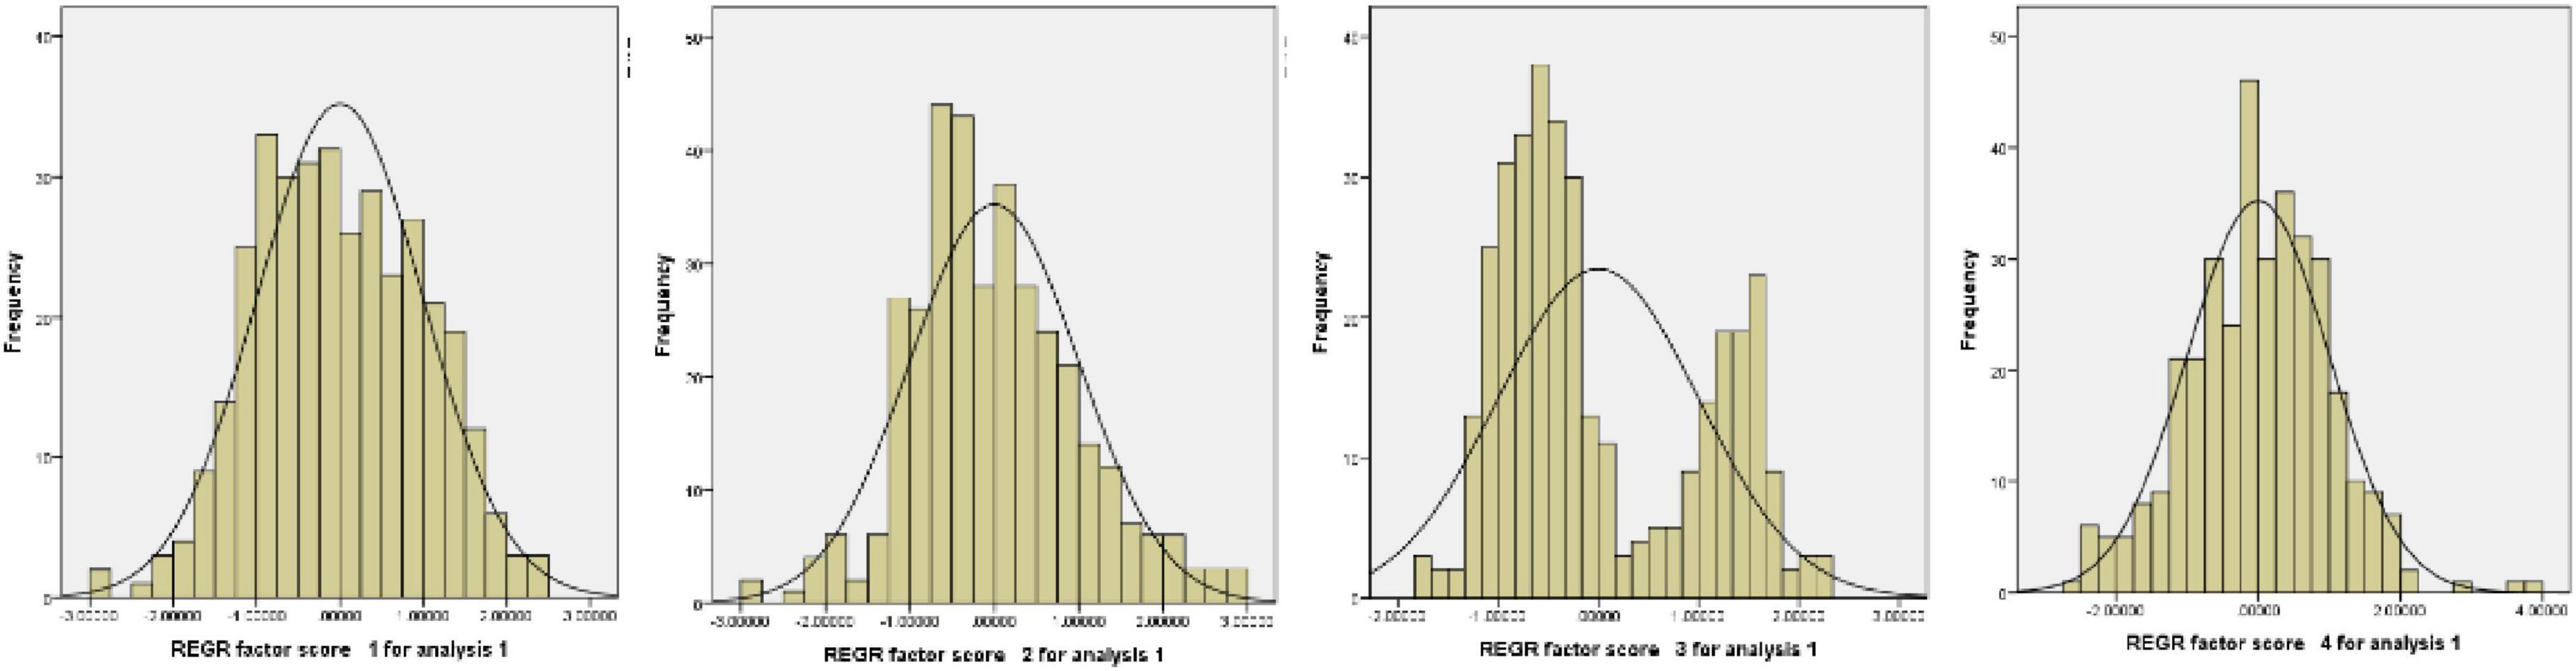
Figure 2. Frequency histogram of the principal components.
K-means analysis determined the appropriate number of groups. The research tested clusters ranging from two to eight to find the best fit. Table 2 shows the sample distribution and proportions for each group. The research performed factor extraction based on inter-variable correlations. All correlation coefficients are below 0.3. This confirms the variables are independent. No significant multicollinearity exists.
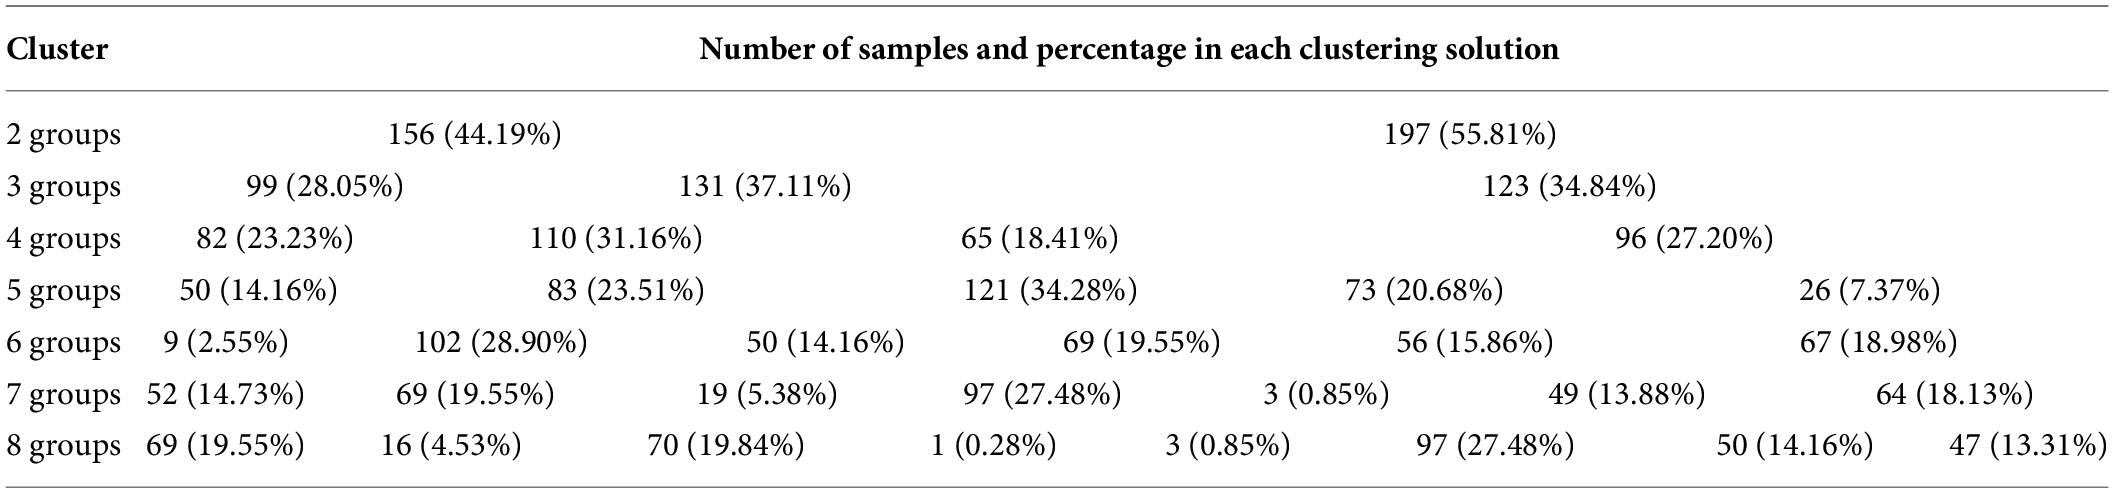
Table 2. Number of samples and percentage in each clustering solution.
Results of factor analysis
In Figure 3, the research examined models with three to eight groups based on K-means results. All models showed clear and non-overlapping boundaries. The six cluster model demonstrated the strongest differentiation. As shown in Table 3, all anthropometric variables had a Sig. < 0.05. Other models showed partial overlaps. These results validate the six-cluster solution, which is the most effective way to represent male body shape diversity in this sample.
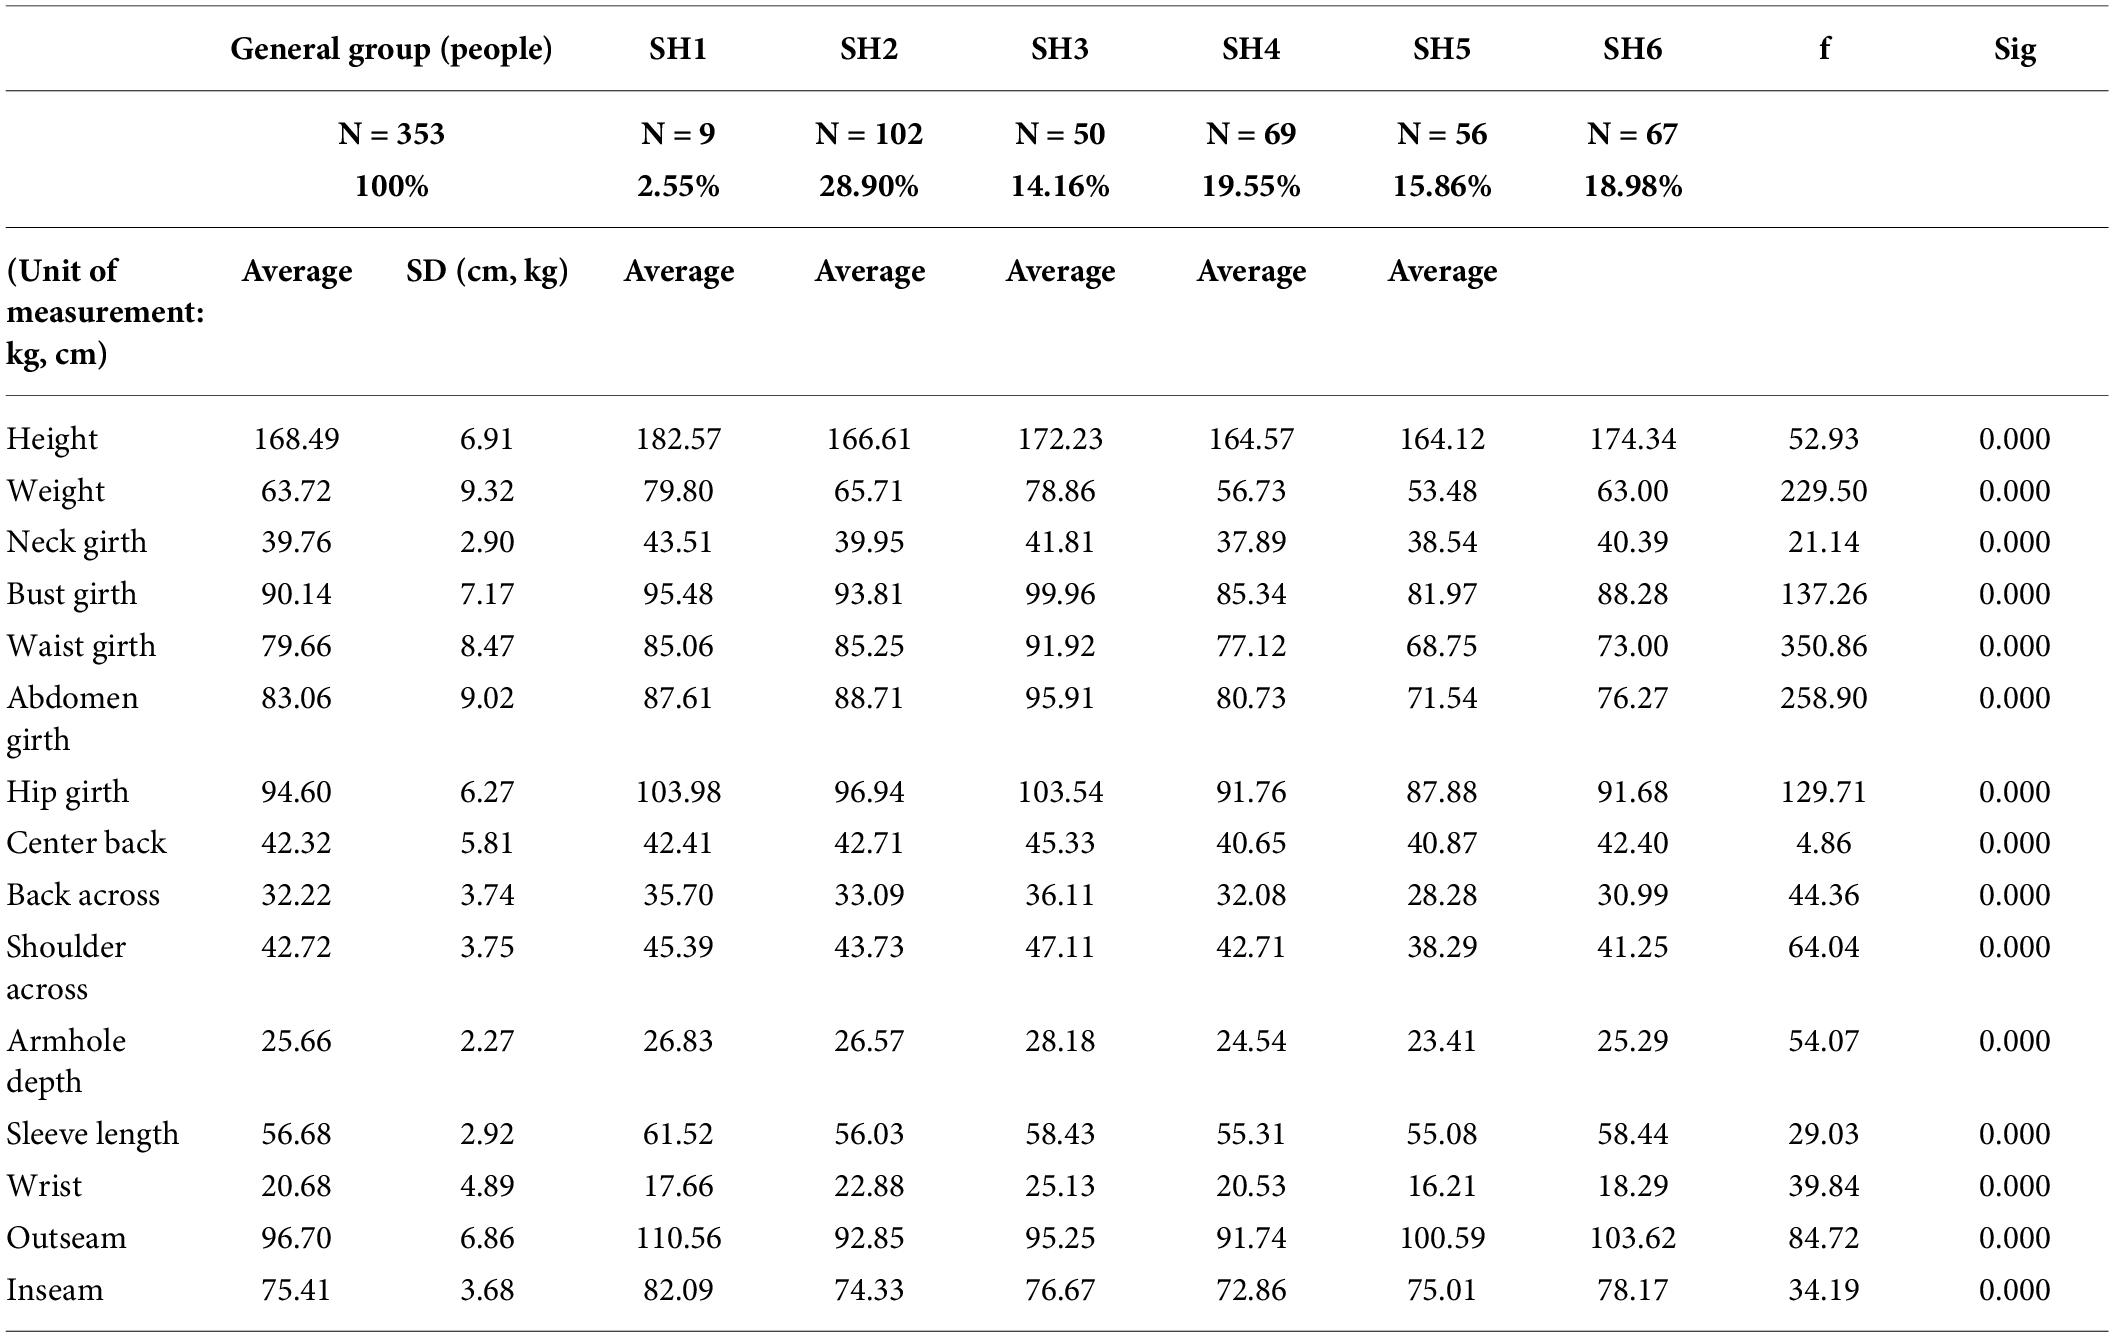
Table 3. Analysis of variance (ANOVA) analysis results of six body shape groups.
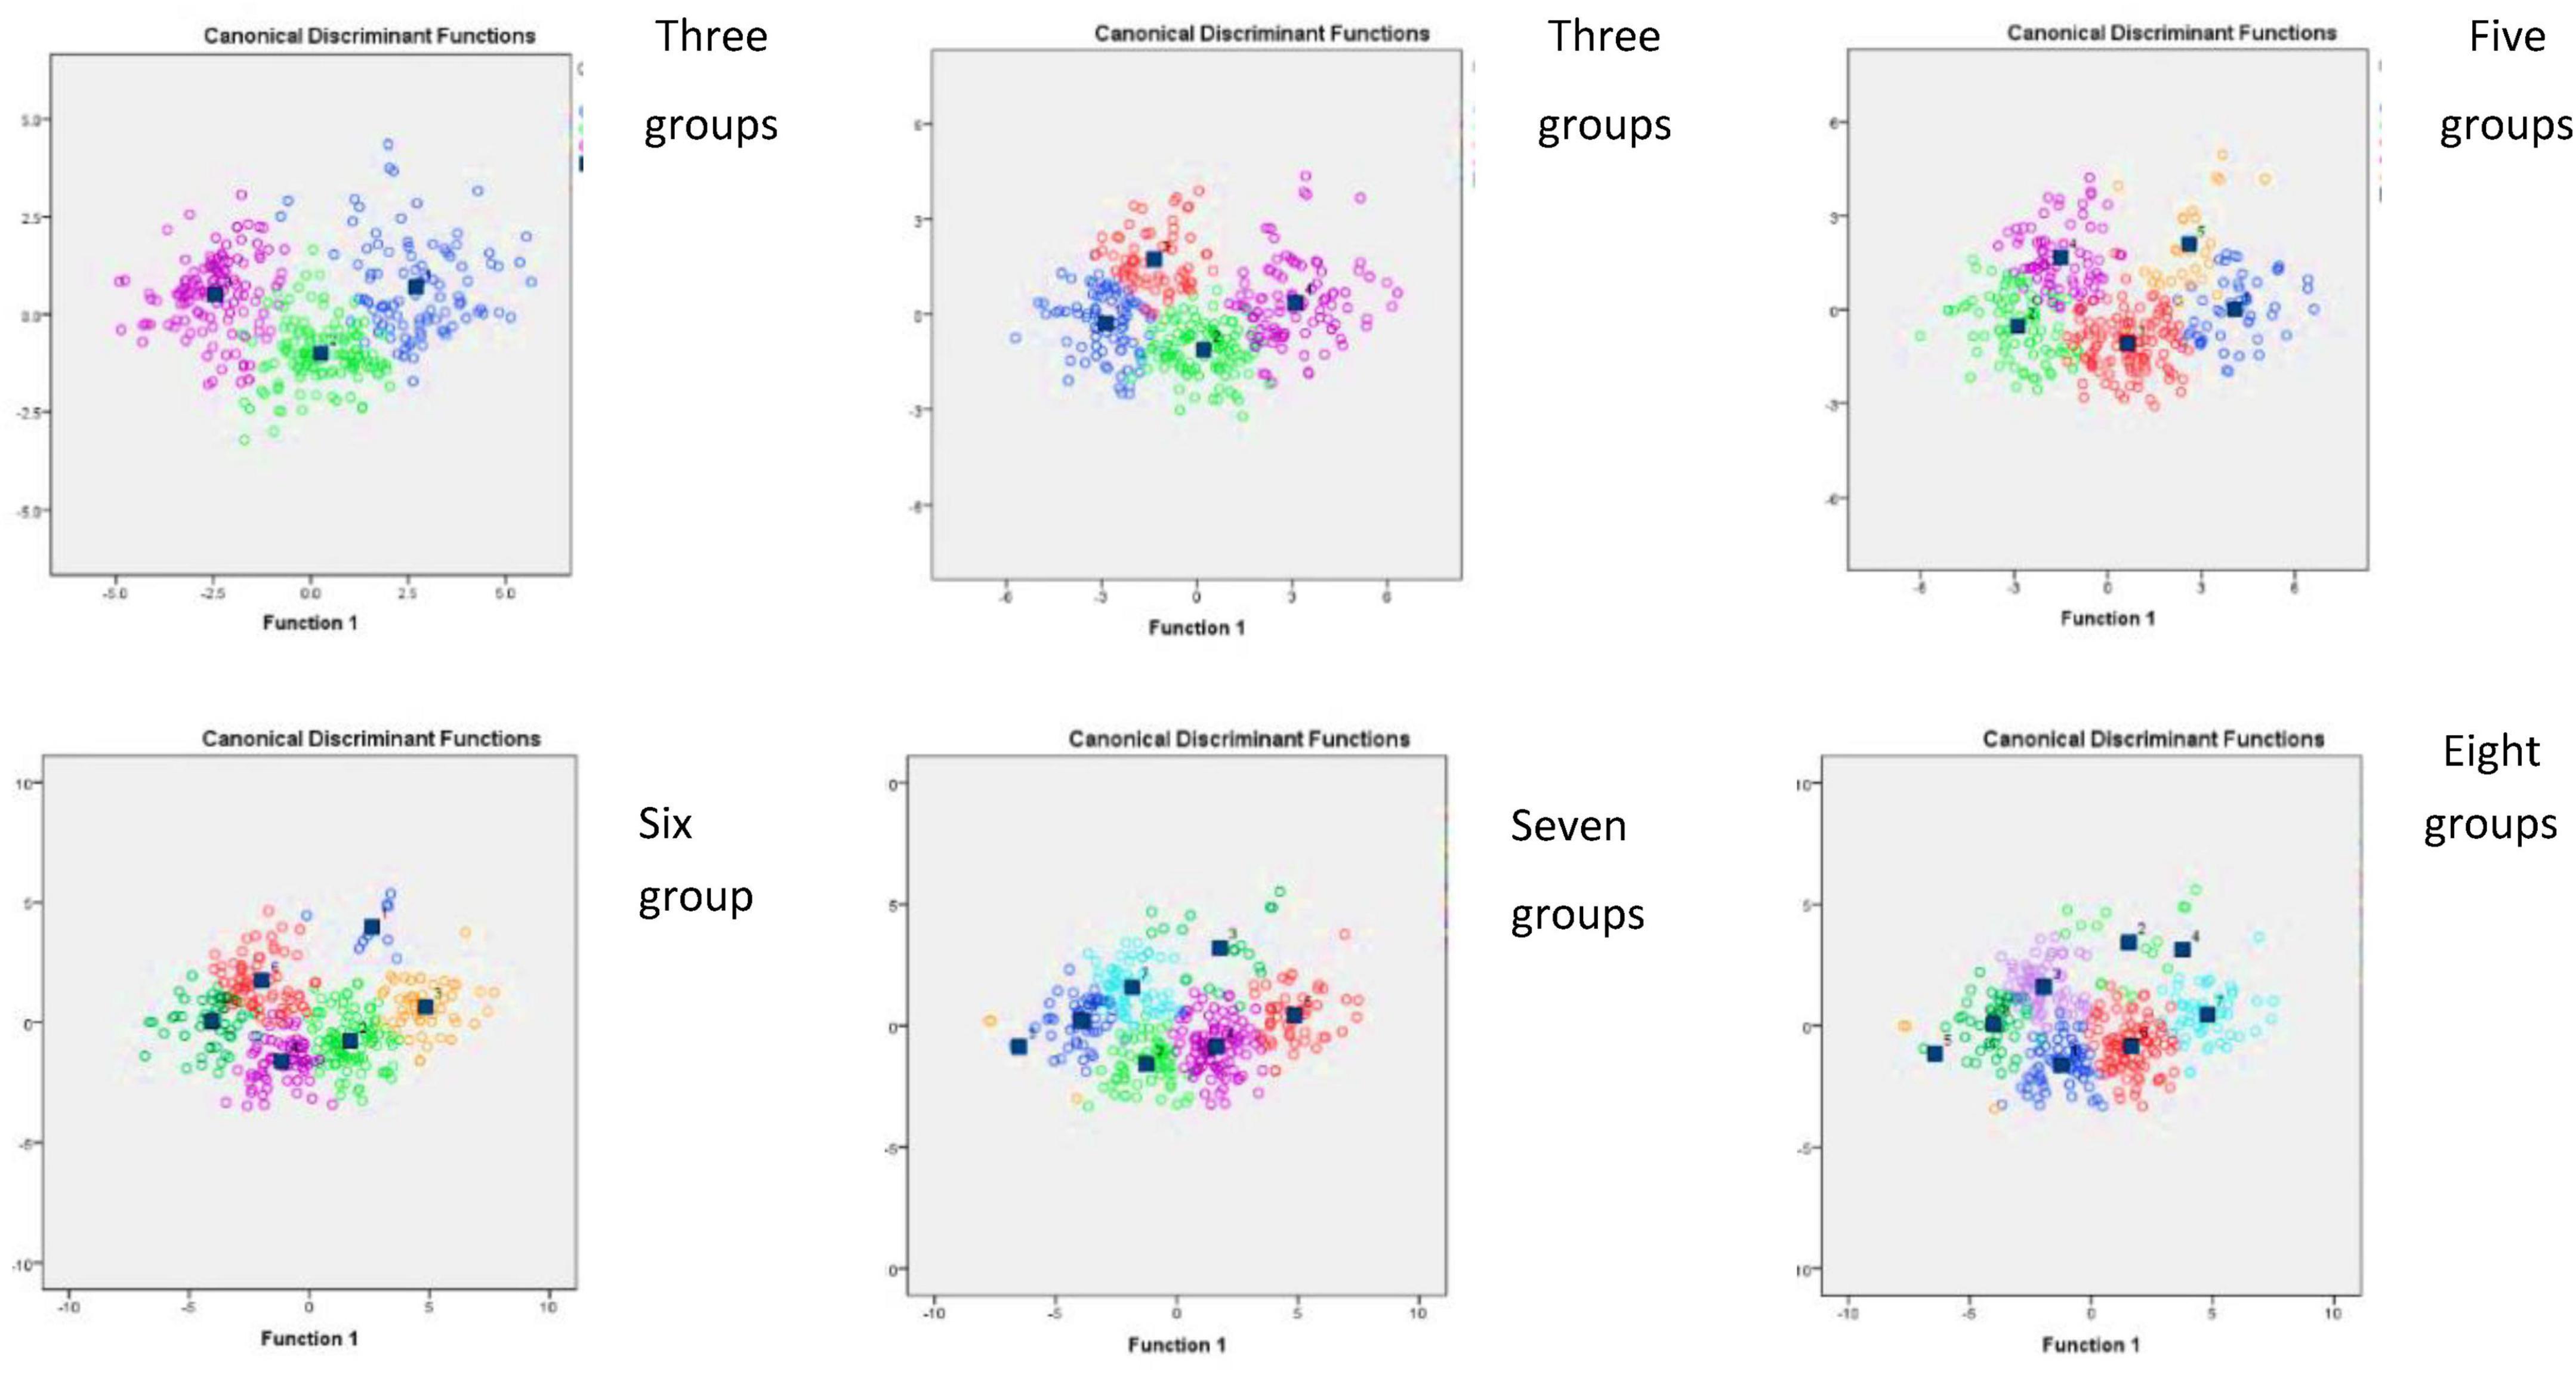
Figure 3. Results of dividing clusters of body shapes.
Establishing avatars for body shape groups
Table 4 shows the classification of six male body shape clusters. The research used BMI, DROP, and WHR for this grouping. The general group has a rectangular and well-proportioned physique. Their indices fall within the normal ranges of the WHO. Shape 1 (SH1, 2.55%) has a trapezoidal form. These men are tall with broad hips. They have a high BMI and high DROP, but a low WHR. This indicates an overweight status with a strong contrast between bust and waist. Shape 2 (SH2, 28.9%) shows a narrow oval shape. They have average height and a protruding abdomen. The BMI is above 23. This suggests a tendency toward being overweight. Shape 3 (SH3, 14.16%) exhibits a wide oval form. These are the tallest individuals. They have the highest BMI (above 25), the smallest DROP, and the highest WHR (0.93). These values align with obesity and abdominal fat. Shape 4 (SH4, 19.55%) has a wide rectangular form. Their height is slightly below average. The DROP is low and the BMI is moderate (20.95). This reflects a balanced body. Shape 5 (SH5, 15.86%) presents a narrow rectangular shape. They are short and slender. They have the lowest BMI, a high DROP (10.43), and a small WHR (0.81). This indicates a lean body type. Shape 6 (SH6, 18.98%): This group is an inverted triangle. These men are tall with broad shoulders. They have a high DROP (12.01) and a low WHR (0.83). The BMI is 20.73. This represents an athletic physique.
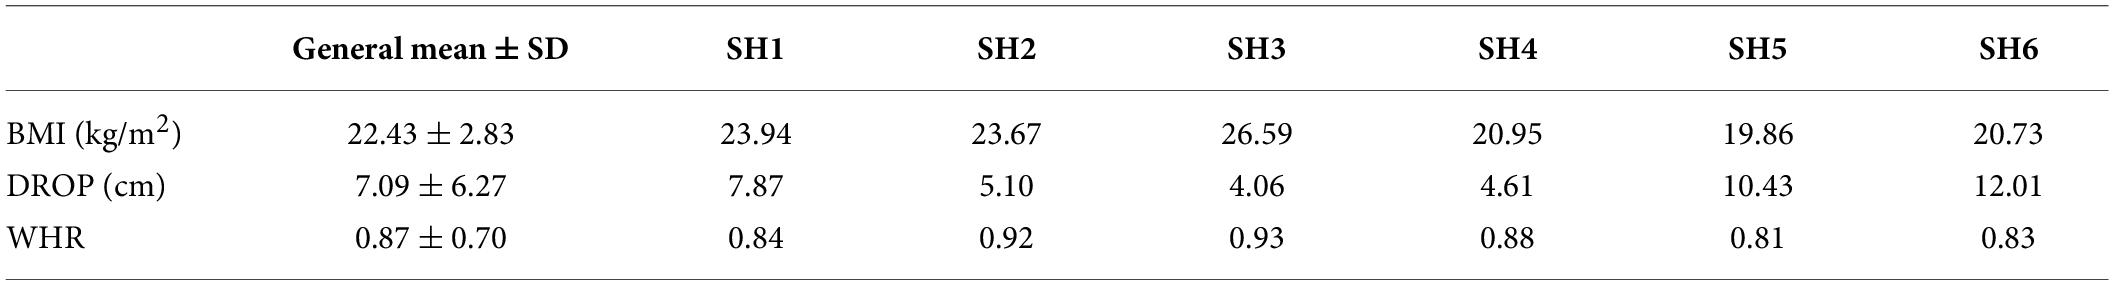
Table 4. BMI, DROP (Formula 2), WHR (Formula 3), and indexes of six body shape groups and general groups.
The research generated avatar data for the six body shape groups. The models were based on the measurements from Table 3. We used CLO3D simulation software for this process. The groups include SH1, SH2, SH3, SH4, SH5, and SH6. Figure 4 shows the simulation results. These images illustrate the avatar creation process. They also highlight the morphological differences between each group.
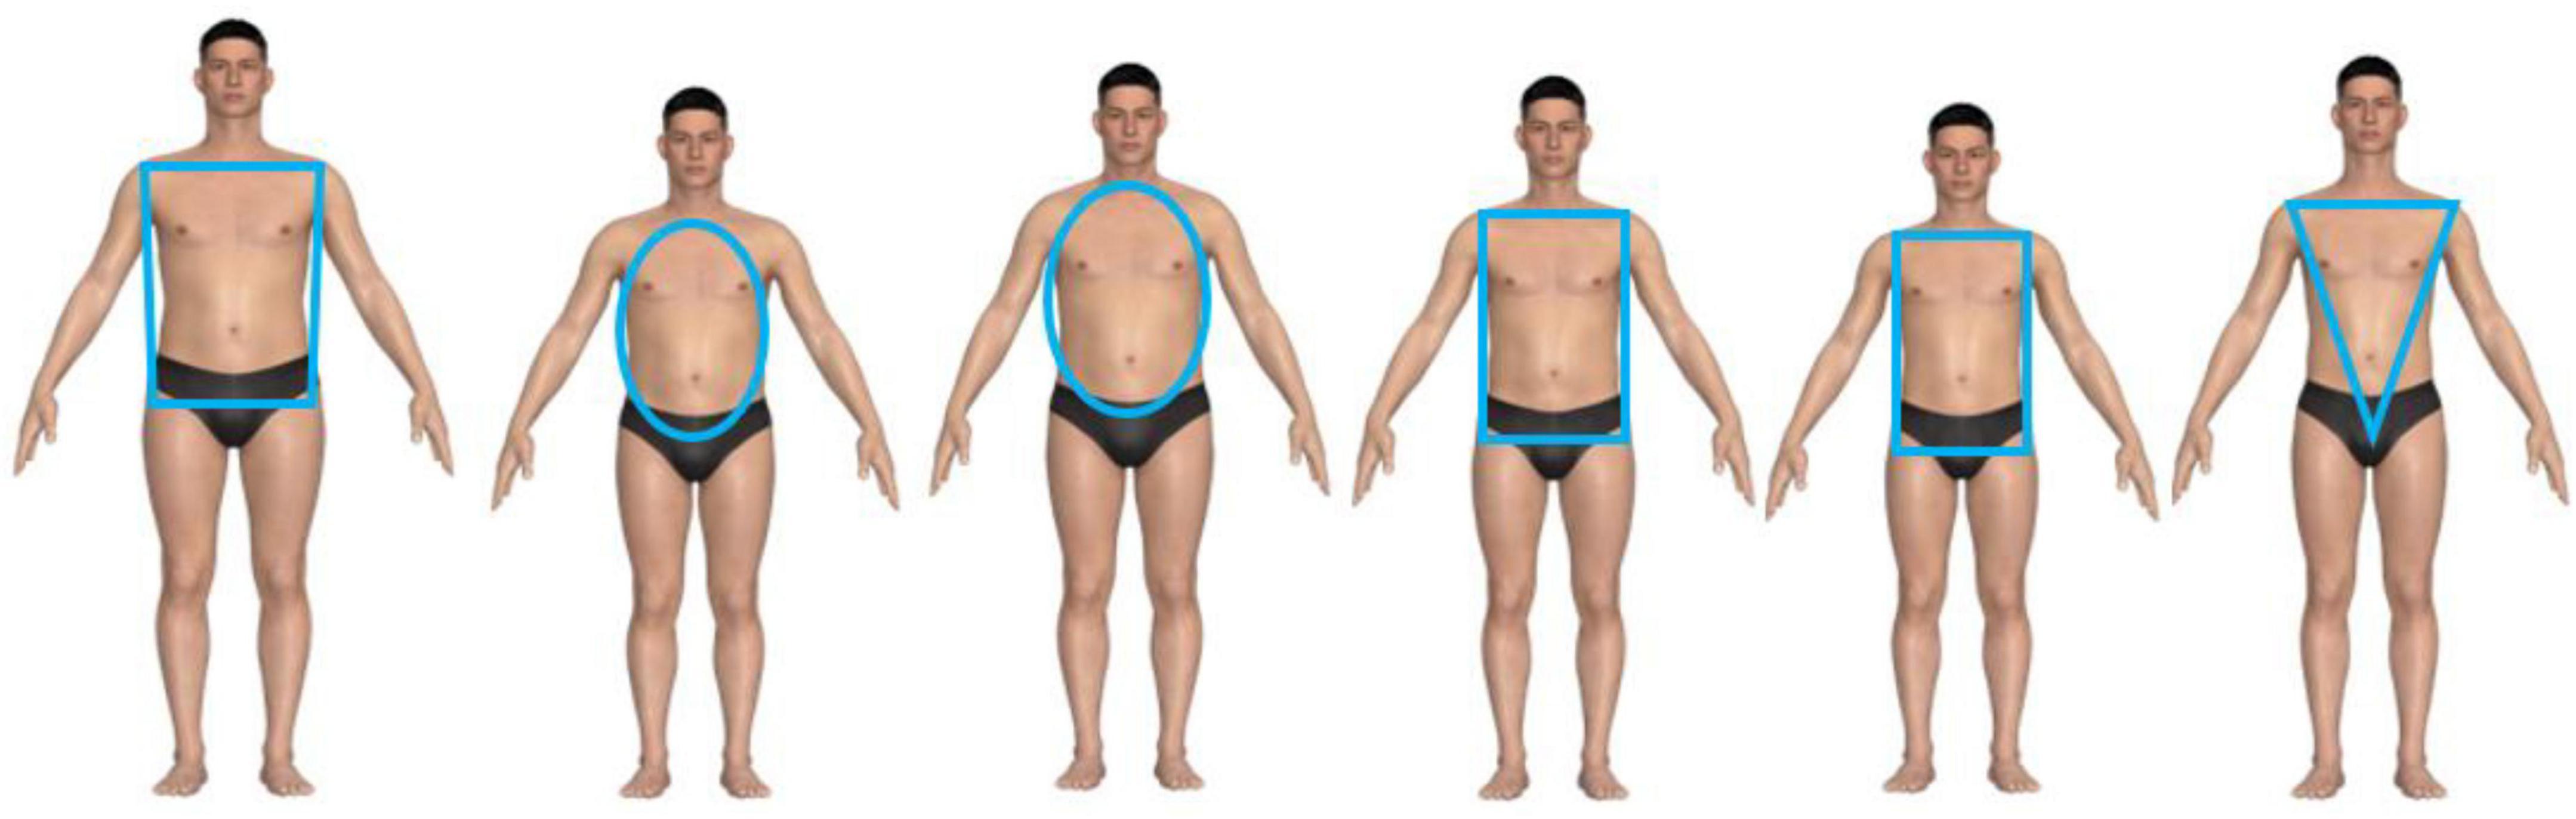
Figure 4. The body shapes of the six groups.
Establishing membership functions
The model employs a Sugeno fuzzy controller that is used in this research. This model operates by taking a single input variable, which is the BMI index. Based on this input, the fuzzy system processes the information and produces an output. This is a coded number that corresponds to a specific body shape group. Using BMI as the sole input makes the process simple and efficient. This approach also ensures that the output accurately classifies individuals into their respective body shape groups. This makes the model both time efficient and practical for applications where quick body shape recognition is necessary.
The membership functions used in this model are triangular in shape, as shown in Figure 5. These functions represent the measurement ranges of six distinct body shape groups. Each group corresponds to a specific membership function, as shown in Figure 6 and summarized in Table 5. The values of these membership functions are calculated using Formula (4). This ensures that the model consistently evaluates body shape categories based on precise mathematical criteria. In this model, the BMI is constrained within boundary conditions ranging from 18 to 28 kg/m2. This interval covers the typical BMI variation observed across the body shape groups. It ensures that the classification process within the fuzzy inference system remains accurate, consistent, and reliable.
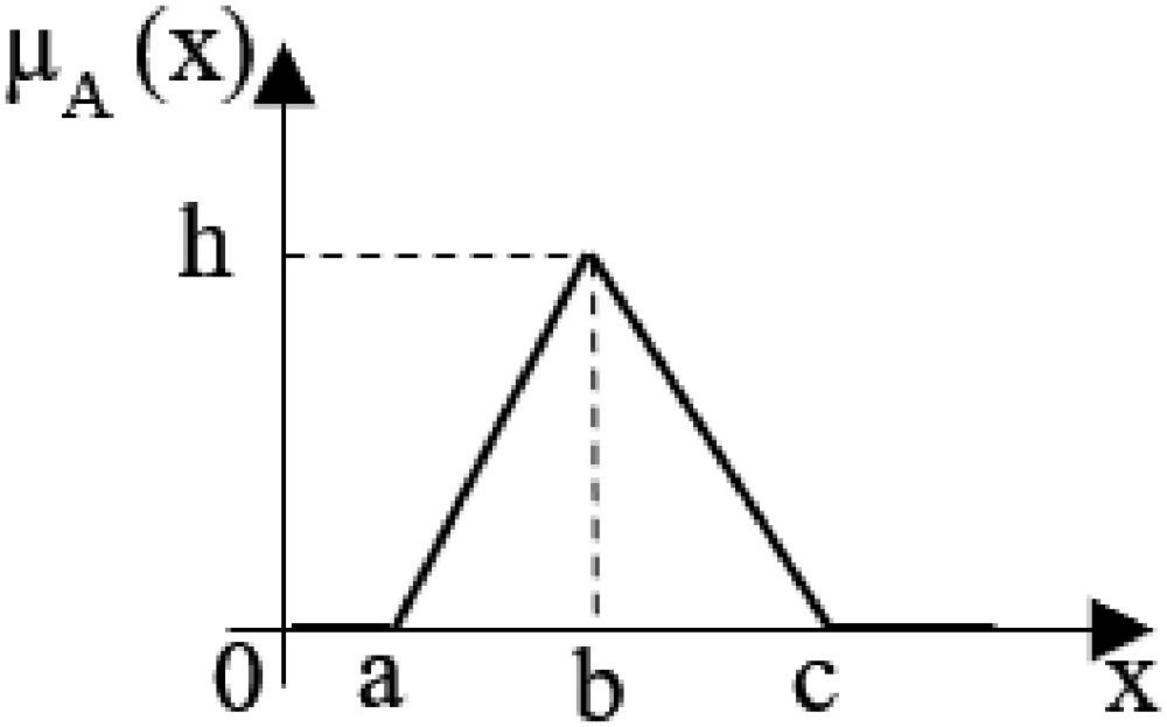
Figure 5. The triangular membership function.
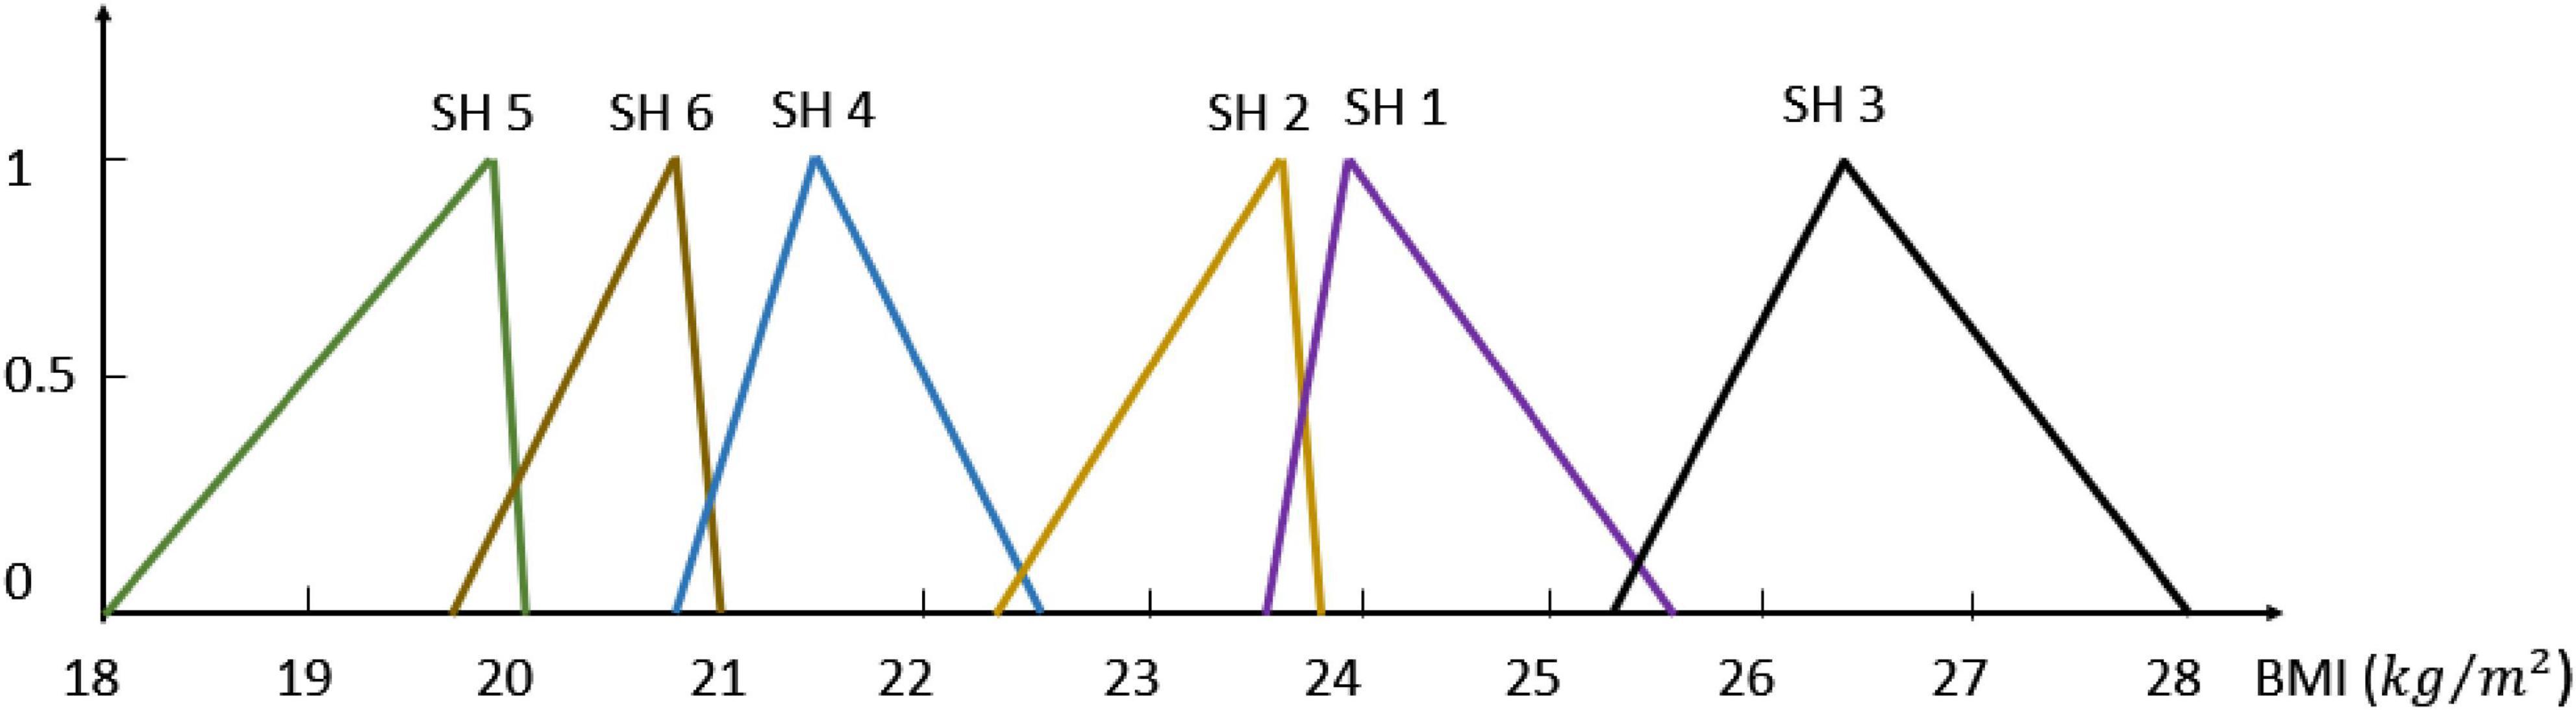
Figure 6. Membership functions for the input.
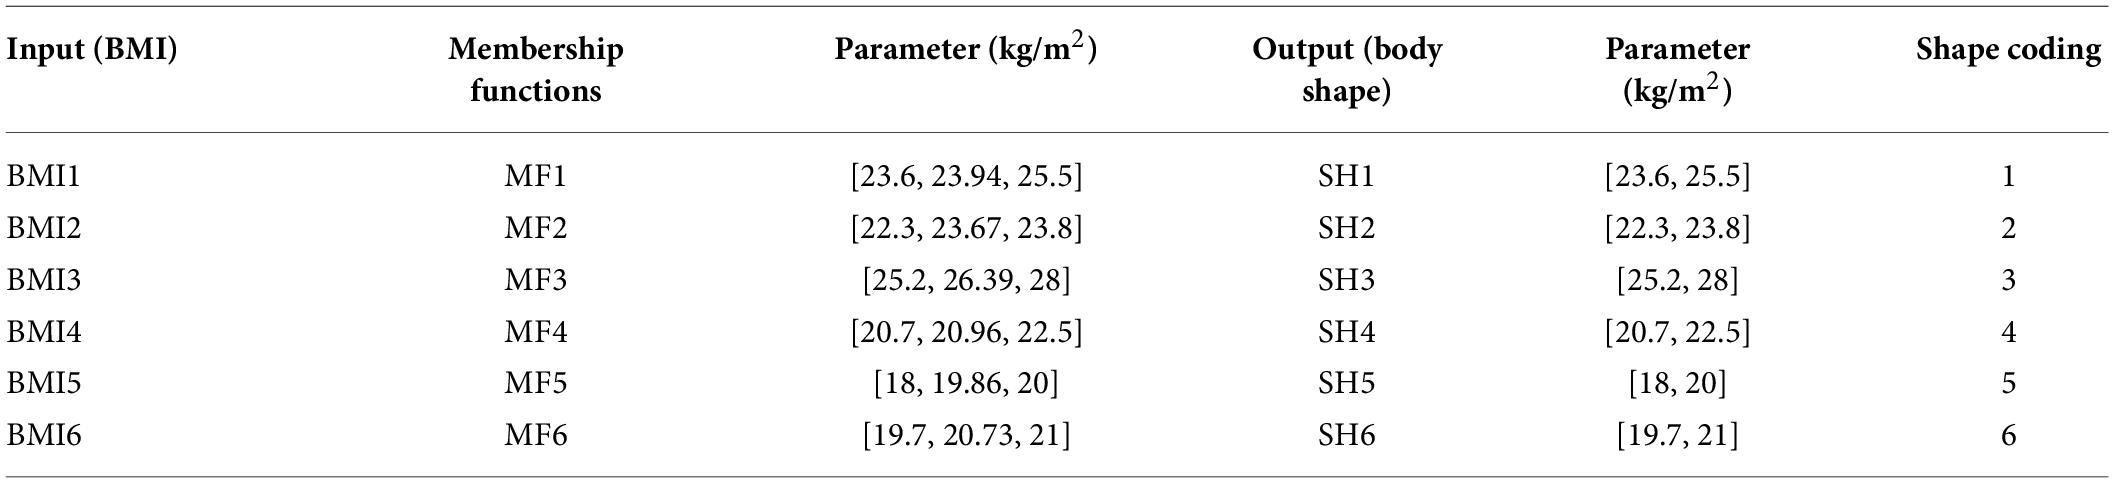
Table 5. Membership functions parameters.
x: BMI index
μA (x): The value of x is placed into the fuzzy set A , with values in the range [0, 1]
a: Left side
b: Triangle vertex
c: Right side
h: Height of the member function
The result of fuzzy sets
The model has structured IF-THEN to practice commands effectively in Sugeno:
If (x is Am) then (y is Bn)
In there:
x is the input, which is the BMI index.
y is the output.
A is the MF for the input.
B is the shape that needs to look for and C∈ N.
m is the number that shows a total of the MF for the input.
n is the shape number having rules.
Fuzzy logic system for classifying male body types based on BMI. The system defines six fuzzy rules, each linking a BMI membership function (BMI1–BMI6) to a corresponding body shape group (SH1–SH6). Logical operations combine the rules to produce a single output, representing the classified body type (Figure 7). The classification process is implemented in a MATLAB function block within Simulink. The function receives the output of the fuzzy logic system. It assigns the value to one of six predefined body shape groups (SH1–SH6) using threshold ranges. Each input value is evaluated against these ranges to ensure consistent labeling. This approach provides reliable and accurate inputs for the fuzzy logic simulation model. It supports rapid body shape classification and subsequent applications in virtual fitting and digital apparel design.
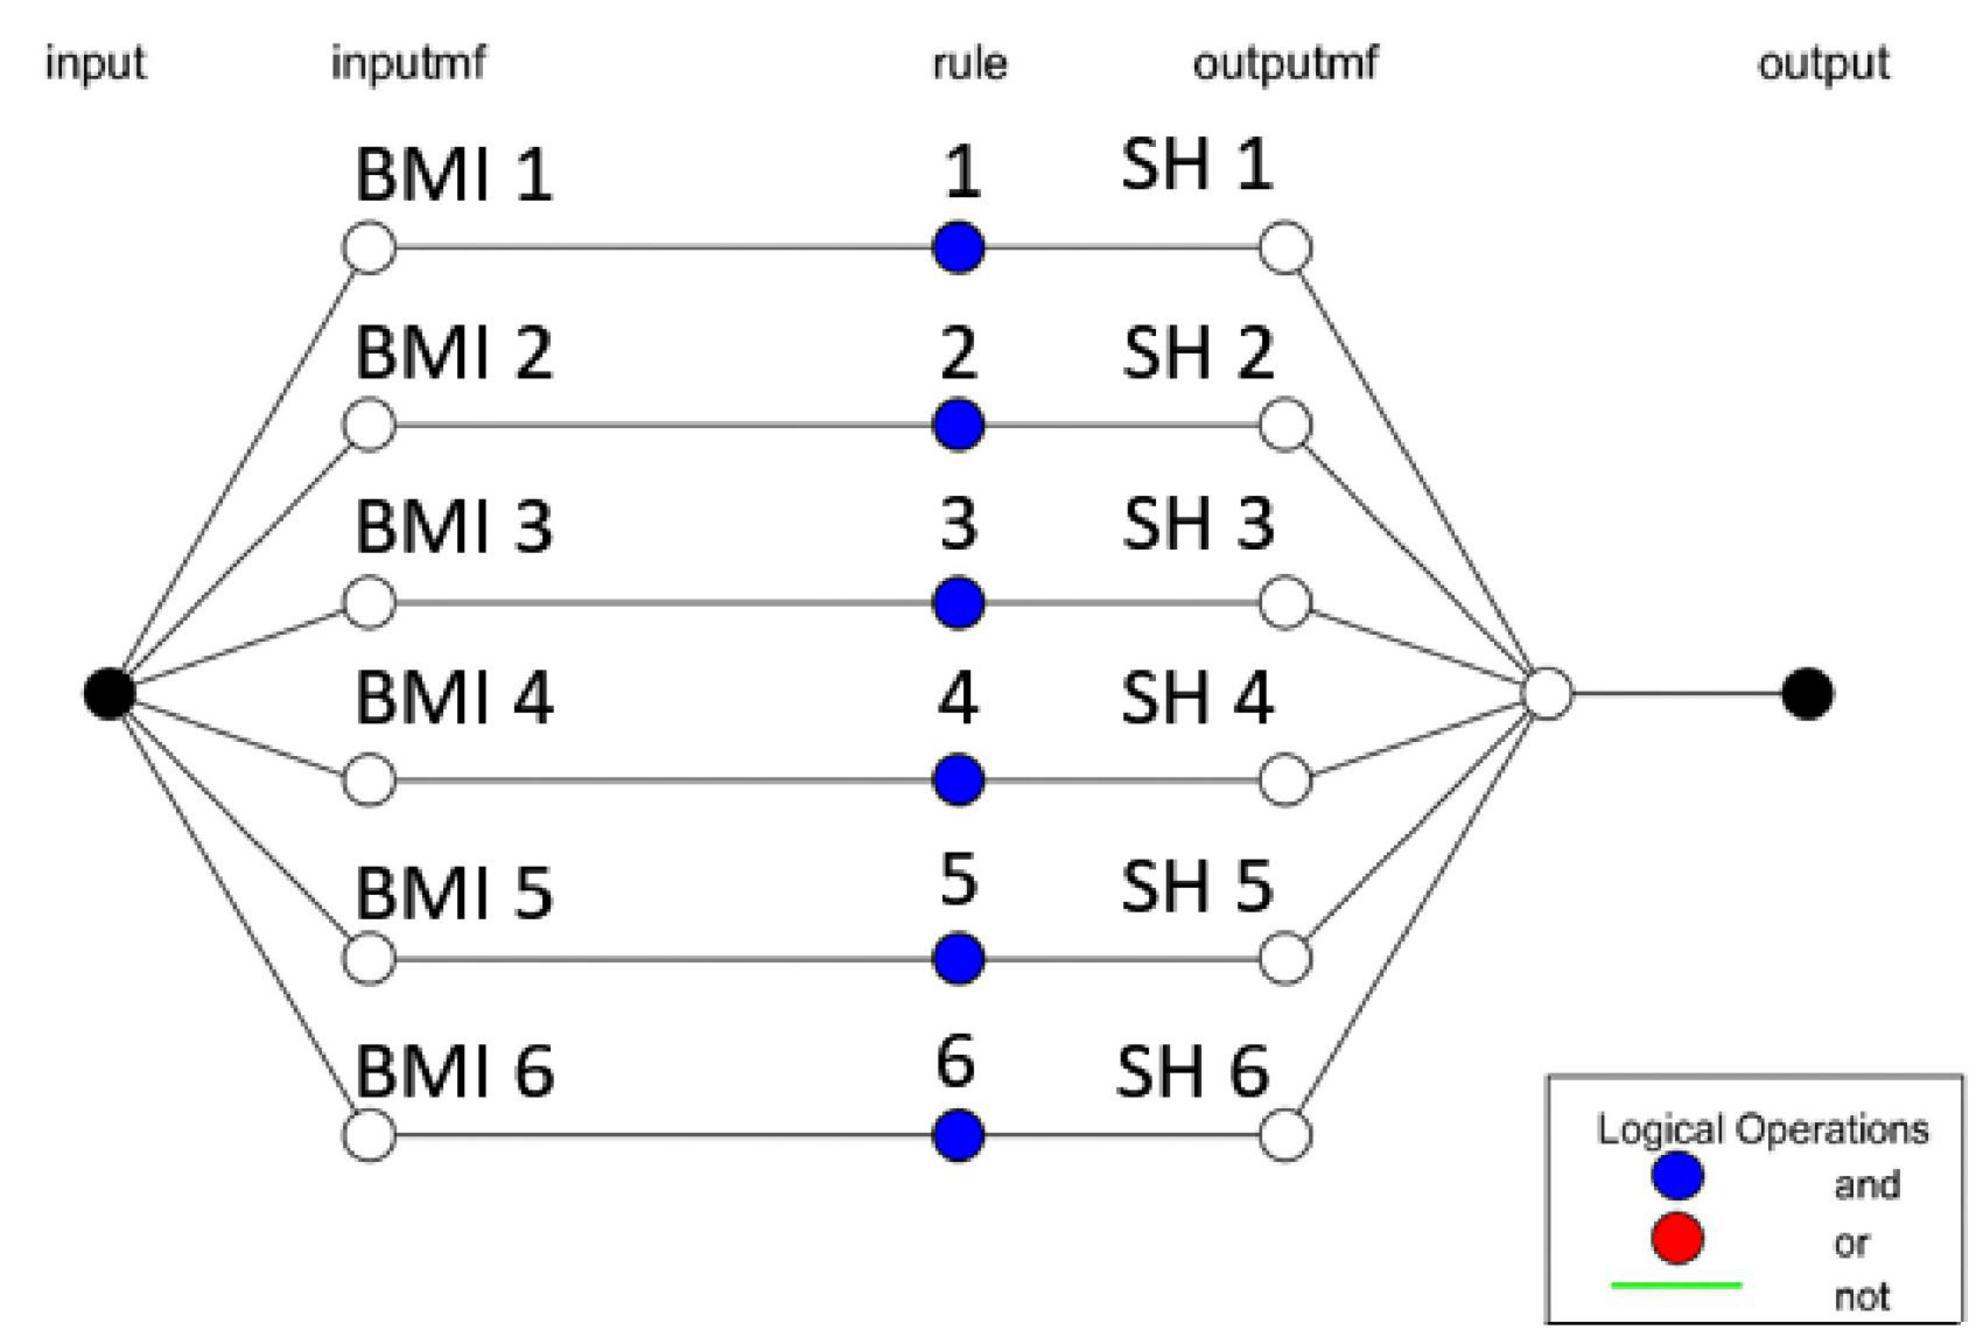
Figure 7. The adaptive neuro-fuzzy inference system (ANFIS) structure for men body shape.
For each input Shapevalue:
If 23.6 ≤ Shapevalue ≤ 25.5 → label = 1
Else if 22.3 ≤ Shapevalue ≤ 23.8 → label = 2
Else if 25.2 ≤ Shapevalue ≤ 28 → label = 3
Else if 20.7 ≤ s Shapevalue ≤ 22.5 → label = 4
Else if 18 ≤ Shapevalue ≤ 20 → label = 5
Else if 19.7 ≤ Shapevalue ≤ 21 → label = 6
This enables an immediate classification of body shape based on BMI, or alternatively, based on weight and height measurements. When a customer inputs their BMI value into the system, the fuzzy logic rules are applied. These rules determine the most appropriate body type group for that individual. The rule table contains the fuzzy rules and their corresponding outputs, guiding the system in assigning the appropriate body type group. By referencing this table, the system accurately matches the given BMI value to one of the six body shape categories. For BMI-based classification, as shown in Figure 8, customers enter their BMI measurements into the rule table. This result is displayed as Figure 9.
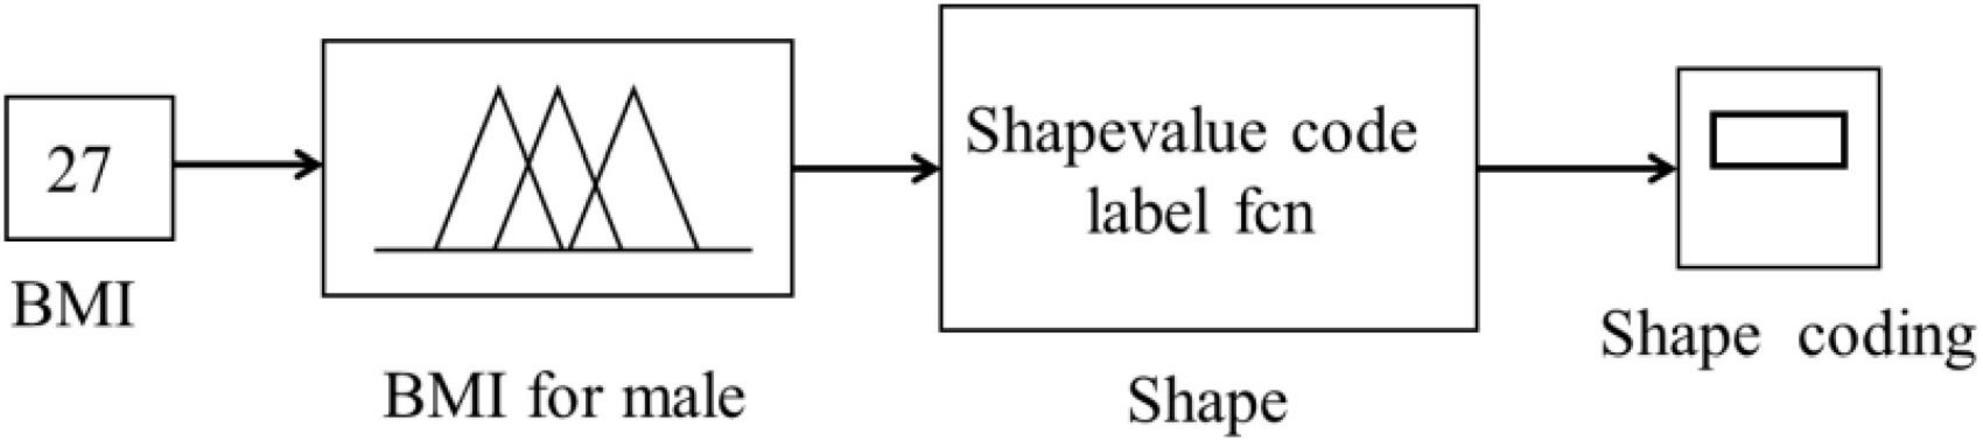
Figure 8. The simulation model for predicting body shape based on BMI input.
Figure 9. Result of body shape coding for SH3.
In cases where BMI information is unavailable, a fuzzy logic simulation model is employed to rapidly infer the corresponding body shape. This model depends on both height and weight to calculate the corresponding BMI value, as illustrated in Figure 10. Once the BMI is determined, this value is processed through the fuzzy logic controller, which displays a single output that categorizes the customer into a specific body shape group. This result is displayed as Figure 11. The resulting measurement can then be cross-referenced with the data in column 4 of Table 5 and compared with Figure 4 to identify the corresponding body shape accurately. It is important to note that the boundary conditions for this model are defined as 44.2 ≤ weight ≤ 89.1 (kg) and 157.2 ≤ height ≤ 189.5 (cm), ensuring that the inputs remain within the valid range for accurate analysis.
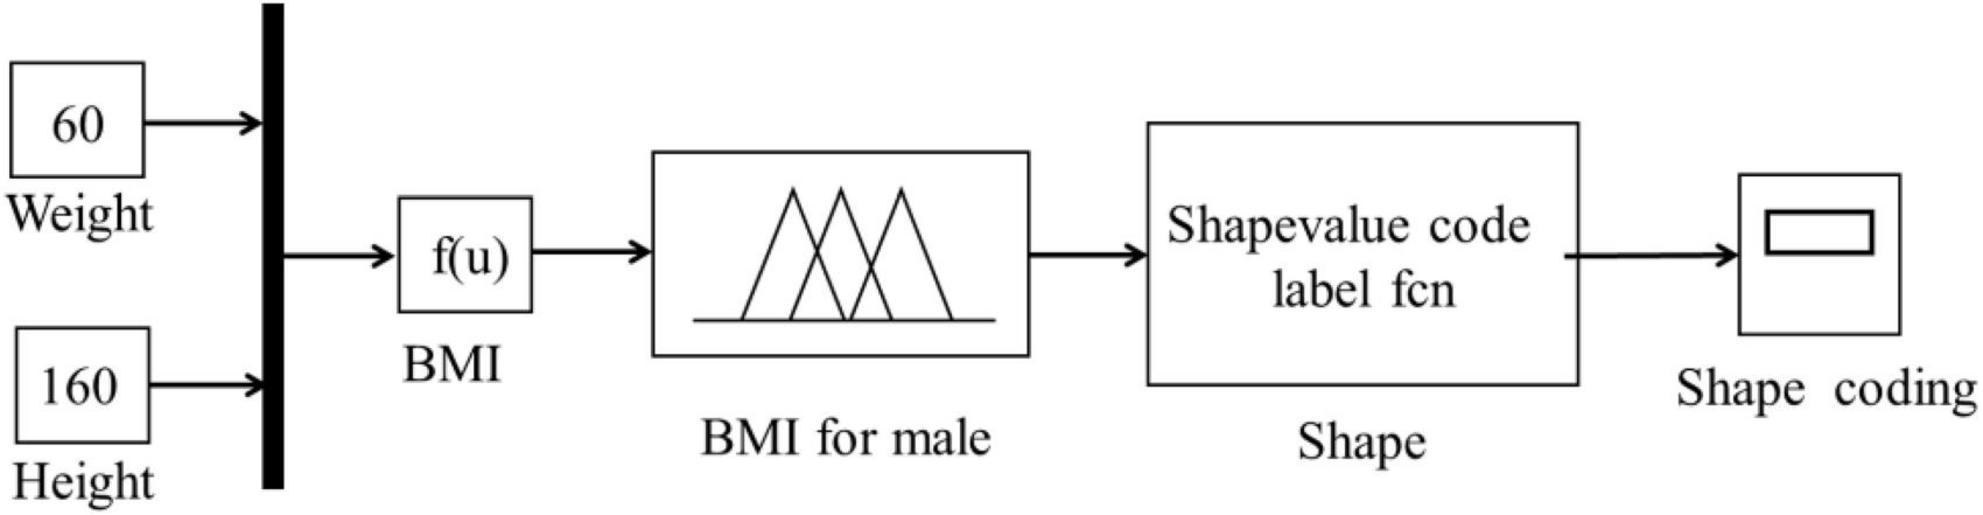
Figure 10. The simulation model for predicting body shape based on weight and height inputs.

Figure 11. Result of body shape coding for SH1.
In there:
x: Weight (kg)
y: Height (m2)
Testing the shape selection model
The body shape prediction model in this study was tested in two ways: first, using only the BMI index; second, using height and weight as inputs. A direct survey was conducted on 30 participants for every way, and their measurements were entered into the simulation program. The program then analyzed the data to identify the corresponding body shape categories, and the results were compared with the actual body shapes shown in Figure 4. In both scenarios, the simulation outcomes closely matched the participants’ actual body shapes. This consistency confirms the program’s ability to accurately classify body shapes based on the input measurements, demonstrating the robustness of the simulation model and its applicability in practical scenarios requiring body shape identification.
The fuzzy inference times for predicting a body shape are about 30 seconds. When we start entering body weight and height). If we analyze body shape using traditional methods (measuring, taking photographs, and calculating body measurements), it will take at least 5 minutes to predict body shape. Therefore, this shows that predicting body shape using fuzzy logic techniques will help us know the body shape fastest. The model is also applicable to remote body evaluation for garment fitting.
Discussion
The study applies fuzzy logic to BMI data to model smooth transitions between body shape categories. Unlike fixed thresholds, this approach captures gradual variations in body types. BMI values of men in Southern Vietnam were compared with national data from previous years. The results align with the WHO’s reported upward trend. In the fuzzy inference system, BMI values above 23 and 25 correspond to the “overweight” and “obese” categories, respectively. These indicate increasing health risks and reduced physical efficiency.
The model reflects diversity across six male body shape groups. They range from short and slender individuals, with an average height of 164.12 cm and weight of 53.48 kg. They also include tall and heavier men, with an average height of 182.57 cm and a weight of 79.80 kg. Compared with the TCVN 5782:2009 standard (28), which reported male heights from 150 cm to 179 cm, these results indicate a gradual increase in stature over the past 16 years.
From an applied perspective, the fuzzy simulation model allows rapid body shape recognition using only height and weight. This supports personalized clothing recommendations, virtual fitting rooms, and online retail. By accommodating a continuum of body shapes, the model enables adaptive sizing systems. It improves customer satisfaction, reduces returns, and promotes inclusive clothing design. The methodology can also be applied to health monitoring and ergonomic interventions, where precise body shape assessment is crucial.
Conclusion
This study analyzed the body shapes of 353 adult males in Southern Vietnam aged 18–60 using cross-sectional statistical and fuzzy logic methods. Factor analysis identified four main body dimension components, which served as the basis for clustering. Through K-means and analysis of variance (ANOVA) analyses, six distinct male body shape groups were established. BMI, DROP, and WHR indices were applied according to WHO standards. This approach allowed a clear distinction among body types, ranging from thin to obese and well-proportioned individuals. The results indicate that the average height of Southern Vietnamese men has improved compared with the TCVN 5782:2009 standard. This reflects positive trends in physical development. Importantly, a fuzzy logic simulation model was developed to classify body shape quickly and accurately using only height and weight inputs. The model effectively addresses uncertainty in anthropometric measurements and demonstrates the adaptability of fuzzy inference in apparel-related applications. It offers valuable potential for integration into intelligent systems such as 3D avatar generation, garment sizing, and virtual fitting platforms. This study contributes to both the scientific understanding of anthropometric variation in Southern Vietnamese men and the development of practical tools for body shape recognition. Overall, this study establishes a scientific foundation for digital fashion design and smart apparel production. Future research could expand the model to include additional anthropometric variables. It could also extend its validation to other populations. These steps would enhance the universality and precision of body shape prediction in the context of Industry 4.0 and personalized fashion innovation.
Funding
The author declares that no funding was received for this research.
Conflict of interest
The author declares that the research was conducted in the absence of any commercial or financial relationships that could be construed as a potential conflict of interest.
References
1. Kousar S, Ramzan MB, Cheema SA, Ahmad S, Rasheed A, Nasir N. Classification of male upper body shape: an innovative approach. J Eng Fibers Fabrics. (2023) 18:1–10. doi: 10.1177/15589250231177447
2. Puch L, Weladji RB, Holand Ø, Kumpula J. The content of reindeer male vocalisations: acoustic cues to age and size. Bioacoustics. (2024) 33(4):387–99. doi: 10.1080/09524622.2024.2366924
3. Gruszka W, Owczarek AJ, Glinianowicz M, Bąk-Sosnowska M, Chudek J, Olszanecka-Glinianowicz M. Perception of body size and body dissatisfaction in adults. Sci Rep. (2022) 12(1):1159. doi: 10.1038/s41598-021-04706-6
4. Shin E, Saeidi E. Body shapes and apparel fit for overweight and obese women in the US: the implications of current sizing system. J Fash Market Manag. (2022) 26(5):759–75. doi: 10.1108/JFMM-09-2020-0213
5. Shin E, Saeidi E. Whole body shapes and fit problems among overweight and obese men in the United States. J Fash Market Manag. (2023) 27(1):1–18. doi: 10.1108/JFMM-02-2021-0039
6. Nizam MEH, Ujevic D. Prediction of Bangladeshi 20-30 aged men’s human body shape. J Text Eng Fash Technol. (2022) 8(5):163–6. doi: 10.15406/jteft.2022.08.00316
7. Valero J, Victoria Ibáñez M, Simó A. Statistical shape analysis of human bodies. Stat Anal Data Min. (2025) 18(4):e70024. doi: 10.1002/sam.70024
8. Lee Y. Estimation of body size and growth patterns in Korean boys. J Physiol Anthropol. (2015) 34(1):20. doi: 10.1186/s40101-015-0058-2
9. Zhang W, Wei Y. Regression-based principal component analysis for sparse functional data with applications to screening growth paths. Ann Appl Stat. (2015) 9(2):597–620. doi: 10.48550/arXiv.1509.05224
10. Kolose S, Stewart T, Hume P, Tomkinson GR. Cluster size prediction for military clothing using 3D body scan data. Appl Ergon. (2021) 96:103487. doi: 10.1016/j.apergo.2021.103487
11. Gry S, Niederlaender M, Lodi A, Mutz M, Werth D. Advances in AI-based garment returns prediction and sizing systems. Proceedings of the 20th International Conference on Smart Business Technologies. (2023). p. 15–25. doi: 10.5220/0012010500003552
12. Monika B , et al. Evaluation of problems while marketing clothing on the basis of anthropometric and body shape variation. Fibres Text East Eur. (2024) 32(1):8–16. doi: 10.2478/ftee-2024-0002
13. Awais M, Krzywinski S, Wölfling BM, Classen E. A validation study on the thermal simulation of the human body-clothing-environment system through wear trials. J Eng Fibers Fabrics. (2021) 16: doi: 10.1177/15589250211041361
14. Wang Z, Xing Y, Wang J, Zeng X, Yang Y, Xu S. A knowledge-supported approach for garment pattern design using fuzzy logic and artificial neural networks. Multi Tools. (2022) 81:19013–33. doi: 10.1007/s11042-020-10090-6
15. Ma S, Yan X. Application of BP neural networks in garment pattern design system. Comp Intell Neurosci. (2022) 2022:8766137. doi: 10.1155/2022/8766137
16. Wang J. Classification and identification of garment images based on deep learning. J Intell Fuzzy Syst. (2022) 44(3):4223–32. doi: 10.3233/JIFS-220109
17. Oosterom EB, Baytar F, Akdemir D, Kalaoglu F. Predicting consumers’ garment fit satisfactions by using machine learning. AUTEX Res J. (2024) 24(1):20230016. doi: 10.1515/aut-2023-0016
18. Zhao X, Fan K, Shi X, Liu K. Virtual fit evaluation of pants using the adaptive network fuzzy inference system. Text Res J. (2021) 91(23–24):2786–94. doi: 10.1177/004051752110205
19. Tan Z, Lin S, Wang Z. Cluster size intelligence prediction system for young women’s clothing using 3D body scan data. Mathematics. (2024) 12(3):497–512. doi: 10.3390/math12030497
20. Zakharkin I, Mazur K, Grigorev A, Lempitsky V. Point-based modeling of human clothing. Proceedings of the IEEE/CVF International Conference on Computer Vision (ICCV). (2021). p. 14718–27. doi: 10.48550/arXiv.2104.08230
21. Wang J, Li X, Pan L, Zhang C. Parametric 3D modeling of young women’s lower bodies based on shape classification. Int J Ind Ergon. (2021) 84:103–42. doi: 10.1016/j.ergon.2021.103142
22. Tran TMK, Nguyen MT, Tran TVA. Classification of body types of Vietnamese middle-aged men in Ho Chi Minh City. Eng Technol Sustain Dev. (2022) 32(5):28–36. doi: 10.51316/jst.162.etsd.2022.32.5.4
23. Hu Y, Xia Y, Gu B. An image-based shape analysis approach and its application to young women’s waist-hip-leg position. Ergonomics. (2074) 66(12):2074–90. doi: 10.1080/00140139.2023.2184366
24. Bian S, Li J, Tang J, Lu C. ShapeBoost: boosting human shape estimation with part-based parameterization and clothing-preserving augmentation. The Thirty-Eighth AAAI Conference on Artificial Intelligence (AAAI-24). (Vol. 38), (2024). p. 828–36. doi: 10.48550/arXiv.2403.01345
25. Wang X, Zhang W, Liu Z. Construction of a simulation model of electromagnetic shielding clothing for shielding effectiveness analysis. Text Res J. (2023) 93(21–22):4889–901. doi: 10.1177/00405175231185131
26. Bridger RS. Introduction to Human Factors and Ergonomic. 5th ed. Boca Raton (FL): CRC Press (2025).
27. George D, Mallery P. IBM SPSS Statistics 29 Step by Step: A Simple Guide and Reference. 18th ed. New York: Routledge (2024).
© The Author(s). 2026 Open Access This article is distributed under the terms of the Creative Commons Attribution 4.0 International License (https://creativecommons.org/licenses/by/4.0/), which permits unrestricted use, distribution, and reproduction in any medium, provided you give appropriate credit to the original author(s) and the source, provide a link to the Creative Commons license, and indicate if changes were made.