Introduction
A key component of national development plans for almost every country in the world is Foreign Direct Investment (FDI). In addition to being a major source of non-debt inflows, it facilitates the transfer of technology and helps build worldwide links, which in turn boosts competitive efficiency. When it came to raising capital from outside sources, developing countries relied heavily on FDI in the 1990s. In addition to helping host nations improve their economies, FDI gives home countries a chance to maximize their profits by making the most of their bountiful resources.
With almost 23% of its workforce working in the services industry, India ranks fifteenth globally. The building, trading, lodging, transportation, communication, and storage businesses are all part of this broad industry. Liberalization policies enacted by the Indian government in the 1990s spurred the country’s fast economic development, positioning it to become one of the world’s most powerful and alluring economies. The arrival of the new century brought widespread excitement about India’s potential as a global powerhouse. The Indian economy was worth USD 3.5 trillion in 2009, making it the world’s fourth biggest. Agricultural output, long seen as the backbone of India’s economy, only contributed 17.5% to gross domestic product (GDP), while the services sector pumped in a whopping 62.5%. Despite global recessions, India’s economy has grown at a steady 7% annual rate since 1997, thanks in large part to information technology (IT) and IT outsourcing.
The services sector, which includes financial, banking, insurance, non-financial/business, outsourcing, R&D, courier, tech testing and analysis constituted the highest portion of the total.
Foreign direct investment (FDI) equity inflow of 16%, amounting to $5,098. Services continue to account for a significant share of total FDI equity flows, ahead of other sectors like computer software/hardware and trading. Over the long term (2000–2025), services have been one of the top sectors for FDI in India, contributing substantially to cumulative equity investment.
Literature review
Komal Yadav (1). In this article, we have seen how nations like India were affected by the worldwide epidemic and the subsequent drop in remittances, FDIs, and official help. Prolonged lockdown has already had a negative impact on lower- and medium-income nations, but the precipitous drop in remittances, FDI, and international assistance has worsened the situations. The whole nation is ensnared in the ruling party’s power struggle, which is reducing the government’s ability to handle the economic collapse. Instead, everyone should be working together to bring an end to the economic crisis by implementing the necessary containment policies and strategically reopening the economy.
Mousumi Bhattacharya and Sharad Nath Bhattacharya (2). Results from their regression analysis showed that tertiary and secondary expansion both affect FDI flows. Growth in the secondary and tertiary sectors leads to an influx of foreign investment, according to the Granger causality test. It also showed that the expansion of both the secondary and tertiary sectors was causally related. FDI is a good source of efficiency-enhancing technologies. Whether it’s a desire for efficiency, access to a larger market, or a mix of the two, foreign companies often choose to invest in a country’s manufacturing industry rather than export to it. In most cases, it creates a lot of jobs and teaches people new skills.
Dr. Ahmad Khalid Khan, Dr. Syed Mohammad Faisal, and Dr. Syed Mohammad Akmal (3). Researchers in this study looked at the new economic trends in India and how they may affect the country’s economic growth and globalization in general. FDI from multinational enterprises (MNEs) and its effects on India’s economy are the primary topics of this article. The research stands out because it examines the characteristics of MNEs’ worldwide operations and their investment patterns in general with an eye on investing in India. In addition, given India’s present economic situation, academics investigate the role of the service industry, one of the most sought-after industries, in attracting FDI and fostering the country’s development and progress. Index Terms: Foreign Direct Investment, Economic Growth, Liquefied Petroleum Gas, Economy, Investment Flows.
A growing number of developing nations are turning to FDI as a means to close the technological gap with high-income nations, improve management abilities, and expand export markets (4).
Many believe that nations in transition rely heavily on FDI for its key industries. This kind of investment is seen as a great way to boost a host economy’s development efforts by providing finance, management, and technology (5).
Further, Findlay (6) makes the argument that FDI has the potential to boost host country productivity by introducing local businesses to the cutting-edge management practices and technology used by international corporations. Research has shown that developing and transition countries see a significant increase in investment as a result of the benefits that FDI brings. These benefits include technological transfer, industrial reorganization, skill development for the workforce, and overall economic impacts on production, income, prices, and the economy as a whole (7, 8).
Foreign Direct Investment (FDI) is also favorable for improving the quality of the production factors, and the question that is it economically sensible to promote FDI through policy initiatives or not appears to be sensitive to host country characteristics, and also there is less evidence that FDI generates positive spillovers for host economies. Countries should be suspicious about the claims that promoting FDI will raise national welfare (9).
Aggregate FDI is unaffected by fiscal incentives, but it is attracted by the abolition of limitations. Conversely, certain economic selection policies promote FDI from both rich and developing nations (10). Sarkar and Lai (11) found that domestic firms are less productive in sectors with relatively high levels of foreign investment compared to sectors with relatively low levels of foreign investment. This was based on measuring the dispersion of overall sector output, which is a good proxy for the extent to which domestic firms have benefited from technology transfer.
Additional advantages from spillovers can only materialize if domestic businesses are eager and able to engage in acquiring foreign know-how and technology (12). Research on the effects of FDI on India’s service exports has shown a statistically significant correlation between the two variables, suggesting that FDI has contributed to the expansion of India’s service exports and that, as a policy goal, FDI should be actively sought after in the years to come (13).
Also, there are significant consequences for the migration of natural people due to the increase in outside FDI from India’s service industry (14). There is evidence of bi-directional causality between inward FDI and the total trade volume in services as well as between FDI and services imports, according to the causal linkages between inward FDI and the country’s engagement in services trade in bivariate and trivariate vector auto regressive (VAR) frameworks. This is a result of the service sector’s relatively liberal trade environment and stance toward FDI (15–22).
Objectives
1. To analyze trends in FDI inflows into India’s service sector (2017–2023).
2. To examine the correlation between total FDI and service sector FDI.
3. To assess the relationship between FDI inflows and GDP.
4. To examine the association between GVA (Financial Services) and service sector FDI.
Research methodology
Secondary sources such as the reserve bank of Indian (RBI) annual report, economic surveys, papers, and journals provided the data used in the research. India is where the research is focused. The link between FDI and the service sector’s contribution to GDP may be discovered via correlation.
The analysis covers a 6-year period from 2017–2018 to 2022–2023. The data include information on cumulative FDI inflows, FDI inflows during the last 5 years with percentage growth, leading five sectors attracting maximum FDI equity, and FDI inflows into the service sector.
Data analysis and interpretation
We can observe from Table 1 the cumulative amount of FDI inflows from April 2000 to March 2023 is USD 9,19,633 million. This represents the total amount of foreign investment that has flowed into the country during this period. Out of this total FDI inflow, the cumulative amount of FDI equity inflow is ₹6,34,441 million. FDI equity inflows specifically refers to the investment made by foreign companies or individuals in the equity (shares) of domestic companies. This data indicates that a significant amount of foreign investment has been attracted to the country, with a total FDI inflow of USD 9,19,633 million. It highlights the confidence of foreign investors in the business environment and growth prospects of the country. The FDI equity inflows also suggest that foreign investors have shown interest in acquiring ownership stakes in domestic companies.
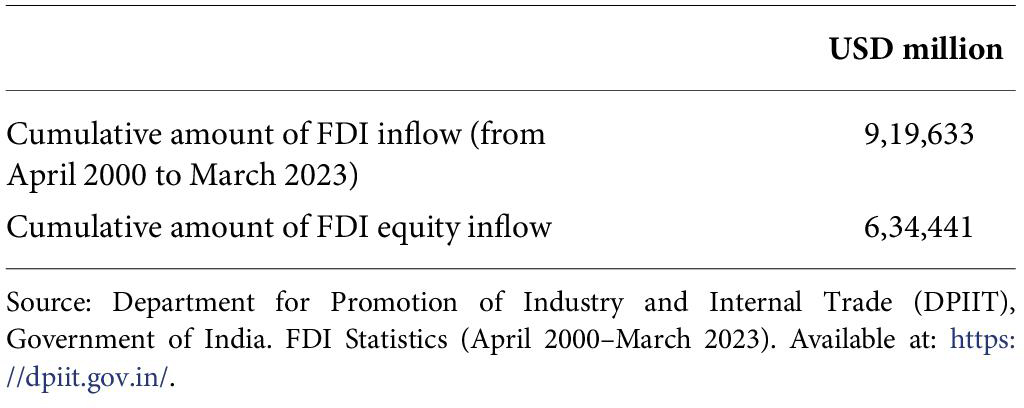
Table 1. Cumulative amount of FDI inflows (in USD million).
It could be observed from Table 2 that during 2017–2018, FDI equity inflow had been USD 44,856 million, involving a growth rate of 3%. This means there was some foreign inflow during the period. FDI equity inflow also dipped marginally during 2018–2019 to USD 44,366 million with a negative growth rate of (−)1. This signals a drop in the foreign investments as opposed to those of the last year. There was substantial growth in FDI equity inflows during financial year (FY) 2019–2020, which were recorded at USD 49,777 million. This is 12% more than in the previous year, which shows a successful recovery of foreign investments. During the fiscal year 2020–2021, the FDI equity inflow rose to USD 59,636 million at a growth rate of 20%. It is evidence of a strong increase in foreign investment over this period. During FY 2021–2022, the FDI equity inflow contracted to USD 58,773 million (negative growth of −1%). This means that there was a slight fall in foreign investment from last year. FDI equity inflow in 2022–2023 plunged to USD 46,034 million (negative growth of −22%). This is a dangerously significant reduction in foreign investment from what was observed last year. In total, the data indicates roller-coaster movements in FDI equity inflow during the last 5 years, where we find both positive and negative growth.

Table 2. FDI inflow in last 5 years and percentage growth.
The five Indian industries that have received the most equity investments from FDI are listed in Table 3. FDI equity inflows have been greatest in the services sector, amounting to 1,02,856 crores (in Indian rupees). The computer software & hardware sector comes in second place, attracting FDI equity inflows worth 94,912 crore. The trading sector has received FDI equity inflows amounting to 39,531 crores, securing the third position. The telecommunication sector has attracted FDI equity inflows worth 39,044 crore, ranking fourth in terms of cumulative investment. The automobile industry comes in fifth place, receiving FDI equity inflows totalling 34,744 crores. Generally, these are the top five sectors that are successful in attracting a high amount of FDI inflows.

Table 3. Leading five sectors drawing in the maximum FDI equity in India.
Table 4 exhibits the amount of FDI inflows into the service sector. In 2017–2018, $6,709 million was invested as FDI inflow into the service sector, but it experienced a decline of −23%. In 2018–2019, there was an increase in FDI inflows, with $9,158 million being invested, representing a growth rate of 28% compared to the previous year. In 2019–2020, there was a decrease in FDI inflows to $7,854 million, indicating a decline of −15% compared to the previous year. The year 2020–2021 experienced the largest decline in FDI inflows, with only $5,060 million being invested, representing a significant decrease of −32% compared to the previous year. In 2021–2022, there was a recovery with FDI inflows amounting to $7,131 million, showing a growth rate of 24% compared to the previous year. Lastly, in 2022–2023, the FDI inflows into the service sector reached $8,707 million; it showed a growth rate of 18% compared to the previous year. There has been an overall increase in FDI inflows from 2017–2018 to 2022–2023, although there have been some fluctuations and declines along the way.

Table 4. FDI inflows to the service sector.
According to the data shown in Table 5, there is a strong inverse relationship between the total FDI equity inflow and the FDI inflow into the service sector. This is further supported by the high negative correlation of −0.7102 between the two variables. When one increases, the other tends to decrease, and vice versa.”

Table 5. Correlation between total FDI inflow and FDI inflow into the service sector.
Table 6 shows the FDI inflows and GDP in crores. In 2016–2017, the FDI inflows amounted to 2,91,696 crores, and the GDP was 1,23,08,193.22 crores. In 2017–2018, the FDI inflows slightly decreased to 2,88,889 crores, while the GDP increased to 1,31,44,582.14 crores. In 2018–2019, FDI inflows increased to 3,09,867 crores, and GDP increased to 1,39,92,913.94 crores. In 2019–2020, FDI inflows further increased to 3,53,557 crores, and GDP increased to 1,45,34,640.78 crores. However, in 2020–2021, while FDI inflows continued to increase to 4,42,569 crores, GDP decreased to 1,36,87,118.14 crores. In 2021–2022, the FDI inflows were 4,37,188 crores, and GDP was 1,49,25,840.37 crores.

Table 6. Relationship between gross domestic product (GDP) and overall FDI inflow in India.
Table 7 indicates the correlation between GDP and overall FDI inflow in India is 0.629124, indicating a high positive correlation. When the GDP of the country increases, it tends to attract more FDI inflows, and vice versa. However, we must note that this correlation might not always be the same and there could be other factors influencing FDI inflows apart from GDP.

Table 7. Correlation between GDP and overall FDI inflow in India.
Gross Value Added (GVA) is the value of goods and services produced by an industry, sector, manufacturer, area, or region in an economy. Table 8 explains that, in 2016–2017, the GVA of the financial services sector was 6,95,983, and the FDI inflow from services was 58,214. In 2017–2018, the GVA of the financial services sector increased to 7,28,670, but the FDI inflow from services decreased to 43,249. In 2018–2019, the GVA of the financial services sector increased to 7,58,170, and the FDI inflow from services increased to B The GVA of the financial services sector was 8,30,392, and the FDI inflow from services was 53,165. From this data, it can be observed that there is no consistent relationship between GVA of the financial services sector and FDI inflow from services.

Table 8. Facilities to account for FDI inflow from services due to GVA of financial services.
From Table 9 we can observe the correlation between the GVA of the financial services sector and FDI inflow from services is −0.3484, indicating low negative correlation. This means that there is an inverse relationship between the GVA of the financial services sector and FDI inflows from services. When the GVA of the financial services sector increases, the FDI inflow from services tends to decrease, and vice versa. However, we must note that this correlation might not always be the same and there could be other factors influencing FDI inflows apart from GAV.

Table 9. Correlation between GVA of financial services and FDI inflow from services.
However, we can see FDI total inflows and FDI into the service sector amounts are shown in Table 10. The percentage growth over the last year indicates the increase or decrease in FDI inflow compared to the previous year. In this research paper, it is found that even when the total FDI inflows are falling, the FDI inflows into the service sector are still increasing.

Table 10. The implication of FDI inflow on the growth of the service sector.
Findings
• The study indicates that a significant amount of foreign investment has been attracted to the country, with a total FDI inflow of USD 9,19,633 million.
• The study shows fluctuations in FDI equity inflow over the last 5 years, with a mix of positive (2017–2018, 2019–2020, 2020–2021) and negative (2018–2019, 2021–2022, 2022–2023) growth rates.
• The study shows that the services sector has received the highest cumulative amount of FDI equity inflow, amounting to 1,02,856 crores (in Indian rupees).
• The study found that there has been an overall increase in FDI inflows from 2017–2018 to 2022–2023, although there have been some fluctuations and declines along the way. The study shows that there is a negative relationship between total FDI inflow and FDI inflow in the service sector
• The study found that there is a positive relationship between FDI and GDP; that is, when FDI increases, the GDP of the country also increases.
• The study also noticed that there is an inverse relationship between GVA of financial services and FDI inflow from the service sector.
• The study reflects that even though the total FDI inflows are falling, the FDI inflows into the service sector are still increasing.”
Conclusion
An important part of India’s economic growth has been the services sector. In terms of FDI, India ranks high among emerging nations. The service industry is becoming more appealing. FDI in the service sector and its effects on the economy was the focus of this study. We have mostly seen that FDI into the service sector is positively correlated with GDP. We are aware of the fact that FDI in the service industry has been rising steadily over the last several years. “FDI in the services sector is positively correlated with GDP growth, which means that a rise in GDP has the potential to boost FDI in the services sector. FDI in the service sector has several benefits. It promotes the transfer of knowledge and technology between countries. Multinational companies investing in the service sector often bring advanced technologies, innovative ideas, and best practices that can be adopted and adapted by local companies. FDI in the service sector can help expand the range of economic activities in the host country, reducing dependence on traditional sectors and creating a more balanced and resilient economy.
Data availability
The study is a descriptive and analytical research based on secondary data.
Funding
The authors received no financial support for the research, authorship, and/or publication of this article.
Conflict of interest
The authors declare that the research was conducted in the absence of any commercial or financial relationships that could be construed as a potential conflict of interest.
References
1. Yadav K. Foreign investment inflows and growth of the secondary and tertiary sector of the Indian economy (2016). Int J Inform Bus Manag. (2022) 8(3):1–12.
2. Bhattacharya M, Bhattacharya SN. COVID-19 outbreak and FDI inflows in India: a sector-wise analytical study. Int J Adv Res Comput Sci Manag Stud. (2016) 10(3):24–40.
3. Khan AK, Faisal SM, Akmal SM. Foreign direct investment (Influx) from different nations and its impact on economic development in India: a detailed study in service sector and its contribution in overall economic development. Int J Sci Res Pub. (2018) 8(5):55–62.
4. World Bank. The East Asian Miracle: Economic Growth and Public Policy. Washington, DC: World Bank (1993).
5. Sahoo D. Foreign Direct Investment in South Asia: Policy, Trends, Impact and Determinants. Asian Development Bank Institute (2001).
6. Findlay R. Relative backwardness, direct foreign investment, and the transfer of technology: a simple dynamic model. Q J Econ. (1978) 92(1):1–16.
7. Ranjan V, Agrawal G. FDI inflow determinants in BRIC countries: a panel data analysis. Int Bus Res. (2011) 4(4):255–63.
8. Accolley D. The impact of foreign direct investment on economic growth in developing countries. J Econ Stud. (2003).
9. Hanson GH. Should Countries Promote Foreign Direct Investment? G-24 Discussion Paper Series, No. 9, United Nations (2001).
10. Banga R. Impact of Government Policies and Investment Agreements on FDI Inflows. Indian Council for Research on International Economic Relations (ICRIER) Working Paper (2003).
11. Sarkar S, Lai Y. Foreign direct investment and productivity spillovers: evidence from sectoral data. Econ Model. (2009).
12. Blomström M, Kokko A. The Economics of Foreign Direct Investment Incentives. NBER Working Paper (2003).
13. Saleena S. Foreign direct investment and service exports in India: an empirical analysis. Int J Bus Manag. (2013).
14. Pradhan JP. Foreign Direct Investment and Employment Growth in Indian Manufacturing Sector. Institute for Studies in Industrial Development (ISID) (2006).
15. Wong K, Tang T, Selvanathan EA, Selvanathan S, Zhang Y, Chan K. Foreign direct investment and trade in services: Evidence from Asia. Appl Econ. (2009).
16. Sharma R, Kaur M. Impact of foreign direct investment on India’s service sector growth. J Econ Pub Policy. (2021) 6(2):45–58.
17. Mukherjee A. FDI in India’s service sector: trends, policy issues and impact. Econ Affairs. (2019) 64(3):527–36.
18. BYJU’S. Foreign Direct Investment (FDI). BYJU’S (2024). Available online at: http://byjus.com/free-ias-prep/fdi/ (Accessed November 27, 2024).
19. Department for Promotion of Industry and Internal Trade (DPIIT). FDI Statistics. DPIIT (2024). Available online at: http://dpiit.gov.in/ (Accessed November 27, 2024).
20. Ministry of Statistics and Programme Implementation (MoSPI). Statistical Data on Indian Economy. MoSPI (2024). Available online at: http://www.mospi.gov.in/ (Accessed November 27, 2024).
21. RBI. Foreign Direct Investment Flows to India: Annual Report 2022–23. RBI (2024). Available online at: http://www.rbi.org.in/ (Accessed November 27, 2024).
22. UNCTAD. World Investment Report 2023: International Investment Trends and Prospects. UNCTAD (2024). Available online at: http://unctad.org/ (Accessed November 27, 2024).
© The Author(s). 2026 Open Access This article is distributed under the terms of the Creative Commons Attribution 4.0 International License (https://creativecommons.org/licenses/by/4.0/), which permits unrestricted use, distribution, and reproduction in any medium, provided you give appropriate credit to the original author(s) and the source, provide a link to the Creative Commons license, and indicate if changes were made.